Overlap among PFF, PFFD, PGX, PGF and CWBPFF is an exchange-traded fund (ETF) that invests preferred stocks (fixed-rate, floating-rate, and convertible).
PFFD is similar to PFF, but the number of holdings of PFFD is almost half compared to PFF. The expense ratio of PFFD is also about half of PFF.
PGX is an ETF that invests fixed-rate
Key stats
About iShares Preferred and Income Securities ETF
Home page
Inception date
Mar 26, 2007
Structure
Open-Ended Fund
Replication method
Physical
Dividend treatment
Distributes
Distribution tax treatment
Ordinary income
Income tax type
Capital Gains
Max ST capital gains rate
39.60%
Max LT capital gains rate
20.00%
Primary advisor
BlackRock Fund Advisors
Distributor
BlackRock Investments LLC
PFF targets preferred securities irrespective of credit rating, providing a broad and diversified portfolio. The funds holdings reflect the nature of the market in that financial institutions dominate the holdings. The underlying index and portfolio are rebalanced monthly. PFF particularly stands out for strong block liquidity, making it the fund of choice for large traders. For investors, it is important to consider how much of the distribution can be classified as qualified dividend income. Prior to February 1, 2019, the fund tracked a similar index from S&P.
Related funds
Classification
What's in the fund
Exposure type
Corporate
Stock breakdown by region
Top 10 holdings

Preferreds set to move lower$PFF - Preferred stocks have reached a critical maximum for now and with today's price action we may see an additional confirmation to RSI an MACD. RSI has already dipped for a sell signal and MACD is showing a strong divergence with the price. Volume activity is showing as well that buying power is

PFF 2020-11-16TICKER : PFF
DATE : 16/11/2020
PRICE : $37,71
TRANSACTION : $94 286 000,00
AVERAGE TRANSACTION : $7 760 690,29
MAX : $94 286 000,00
% OF MAX : 100,00%
DIFFERENCE FROM MAX : 1214,92%

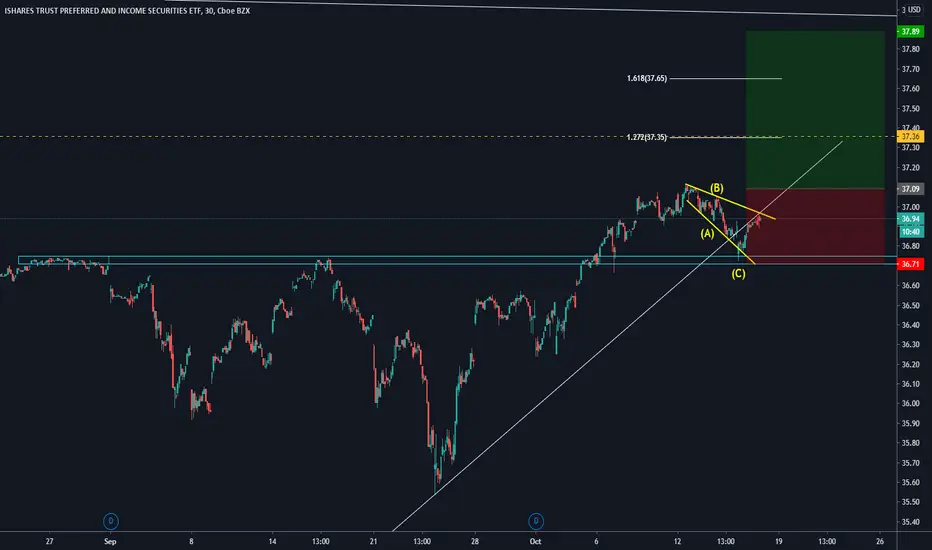
Our Stock of the Day / PFFToday, we have a long trade to share on this ETF. Here is the full explanation
a) The price is above a major Support zone that was resistance before
b) We can see a clear ABC pattern (continuation structure above the Support and on the edge of the ascending trendline)
c) Based on these 3 i
PFF - My personal emotional rollercoaster Hope you learn from my emotional rollercoaster. PFF is supposed to be a stable monthly income play. In fact, some financial advisors treat it as cash/savings account. I was looking to park a large chunk of cash using this instrument in hopes to get a better yield than 1.5% I get from my savings acco

PFF buy the dip with a sugar spoonHaving a hard time with ideas to get long as the market sells off. TLT doesn't seem to play well but the preferreds (mostly bank stocks) are down nicely. I like the yield and I like that preferred means they may not gut the dividend like all the other "so-called" safe names i.e. COP, GE, KMI . I

Long On PFFThis instrument has been trading in a very stable range, more stable than treasuries and similarly to TIPS. The dividend yield on this is 5%+.
This is a great way to diversify exposure to US-assets while assuring a high and reliable return.
If prices drop to 37.10, I'll be buying with very little he

Long on PFFThis instrument has been trading in a range much more stable than treasuries and almost comparable if not better than TIPS, but, the dividend rate is about 5%+
If the price drops down to 37.10, this is an incredible buy opportunity for long-term hold and great way to diversify within US assets.
I'll

PFF overbought going into Fed MeetingPFF is a dogshit, overvalued, poorly managed, preferred stock fund. People have been buying it up going into an obvious rate hike on June 13th... Something like a 12 day winning streak.. Y'all know this is fixed income, right? Bagholders about to get dicked on. Lucky for y'all this is fixed income,

Example of a Downtrend Parallel Channel on PFFPFF formed a downtrend parallel channel.
A downtrend parallel channel (bearish channel) is a continuation pattern that slopes down and is bound by an upper and lower trend line.
The upper downtrend line it is called main line and marks resistance and the lower downtrend line it is called channel lin

See all ideas
Summarizing what the indicators are suggesting.
Oscillators
Neutral
SellBuy
Strong sellStrong buy
Strong sellSellNeutralBuyStrong buy
Oscillators
Neutral
SellBuy
Strong sellStrong buy
Strong sellSellNeutralBuyStrong buy
Summary
Neutral
SellBuy
Strong sellStrong buy
Strong sellSellNeutralBuyStrong buy
Summary
Neutral
SellBuy
Strong sellStrong buy
Strong sellSellNeutralBuyStrong buy
Summary
Neutral
SellBuy
Strong sellStrong buy
Strong sellSellNeutralBuyStrong buy
Moving Averages
Neutral
SellBuy
Strong sellStrong buy
Strong sellSellNeutralBuyStrong buy
Moving Averages
Neutral
SellBuy
Strong sellStrong buy
Strong sellSellNeutralBuyStrong buy
Displays a symbol's price movements over previous years to identify recurring trends.
Frequently Asked Questions
An exchange-traded fund (ETF) is a collection of assets (stocks, bonds, commodities, etc.) that track an underlying index and can be bought on an exchange like individual stocks.
PFF trades at 31.13 USD today, its price has fallen −0.13% in the past 24 hours. Track more dynamics on PFF price chart.
PFF net asset value is 31.19 today — it's risen 3.78% over the past month. NAV represents the total value of the fund's assets less liabilities and serves as a gauge of the fund's performance.
PFF assets under management is 14.20 B USD. AUM is an important metric as it reflects the fund's size and can serve as a gauge of how successful the fund is in attracting investors, which, in its turn, can influence decision-making.
PFF price has risen by 2.88% over the last month, and its yearly performance shows a −2.11% decrease. See more dynamics on PFF price chart.
NAV returns, another gauge of an ETF dynamics, showed a 7.47% increase in three-month performance and has increased by 4.28% in a year.
NAV returns, another gauge of an ETF dynamics, showed a 7.47% increase in three-month performance and has increased by 4.28% in a year.
PFF fund flows account for 102.50 M USD (1 year). Many traders use this metric to get insight into investors' sentiment and evaluate whether it's time to buy or sell the fund.
Since ETFs work like an individual stock, they can be bought and sold on exchanges (e.g. NASDAQ, NYSE, EURONEXT). As it happens with stocks, you need to select a brokerage to access trading. Explore our list of available brokers to find the one to help execute your strategies. Don't forget to do your research before getting to trading. Explore ETFs metrics in our ETF screener to find a reliable opportunity.
PFF invests in bonds. See more details in our Analysis section.
PFF expense ratio is 0.46%. It's an important metric for helping traders understand the fund's operating costs relative to assets and how expensive it would be to hold the fund.
No, PFF isn't leveraged, meaning it doesn't use borrowings or financial derivatives to magnify the performance of the underlying assets or index it follows.
In some ways, ETFs are safe investments, but in a broader sense, they're not safer than any other asset, so it's crucial to analyze a fund before investing. But if your research gives a vague answer, you can always refer to technical analysis.
Today, PFF technical analysis shows the buy rating and its 1-week rating is sell. Since market conditions are prone to changes, it's worth looking a bit further into the future — according to the 1-month rating PFF shows the sell signal. See more of PFF technicals for a more comprehensive analysis.
Today, PFF technical analysis shows the buy rating and its 1-week rating is sell. Since market conditions are prone to changes, it's worth looking a bit further into the future — according to the 1-month rating PFF shows the sell signal. See more of PFF technicals for a more comprehensive analysis.
Yes, PFF pays dividends to its holders with the dividend yield of 6.54%.
PFF trades at a premium (0.08%).
Premium/discount to NAV expresses the difference between the ETF’s price and its NAV value. A positive percentage indicates a premium, meaning the ETF trades at a higher price than the calculated NAV. Conversely, a negative percentage indicates a discount, suggesting the ETF trades at a lower price than NAV.
Premium/discount to NAV expresses the difference between the ETF’s price and its NAV value. A positive percentage indicates a premium, meaning the ETF trades at a higher price than the calculated NAV. Conversely, a negative percentage indicates a discount, suggesting the ETF trades at a lower price than NAV.
PFF shares are issued by BlackRock, Inc.
PFF follows the ICE Exchange-Listed Preferred & Hybrid Securities Index. ETFs usually track some benchmark seeking to replicate its performance and guide asset selection and objectives.
The fund started trading on Mar 26, 2007.
The fund's management style is passive, meaning it's aiming to replicate the performance of the underlying index by holding assets in the same proportions as the index. The goal is to match the index's returns.