will prts get soon to 15?averaged down today on $PRTS, tomorrow should move to top part of the channel its moving in. Lets see how this evolves. Any comments?
PRTS trade ideas


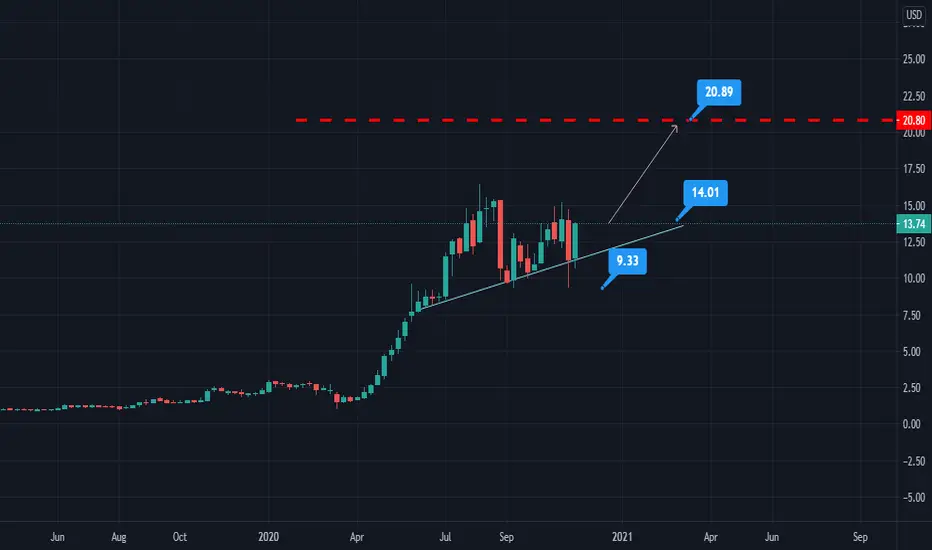
$PRTS Carparts Drives Through Previous Targets - More to Come 🚗
Previous targets hit for some lovely gains,
next entry level above the 20 Moving Average.
Target to previous resistance @ $14.00
RSI crossed above mid-point
Stochastic crossed bullishly.
CEO made a very impressive appearance on CNBC post earnings slump.

$PRTS Carparts.COm Post Earnings Reversal trade
Alert set for a break above $11.00
Potential targets $11.67 & $12.45
Stock suffered a severe drop post earnings but
CEO's appearance on CNBC yesterday may help
attract some interest in the stock.


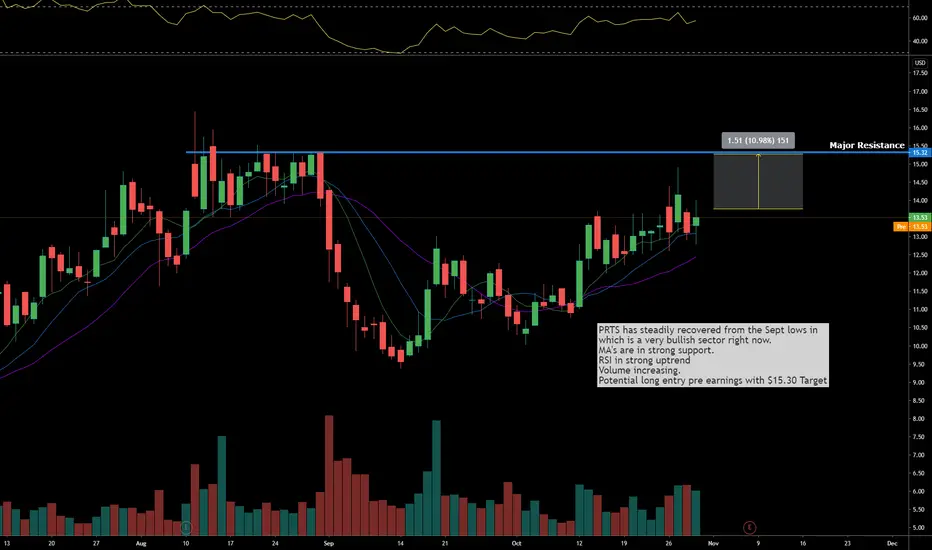
CarParts.com Trade setup Pre earnings $prts
PRTS has steadily recovered from the Sept lows in
which is a very bullish sector right now.
MA's are in strong support.
RSI in strong uptrend
Volume increasing.
Potential long entry pre earnings with $15.30 Target


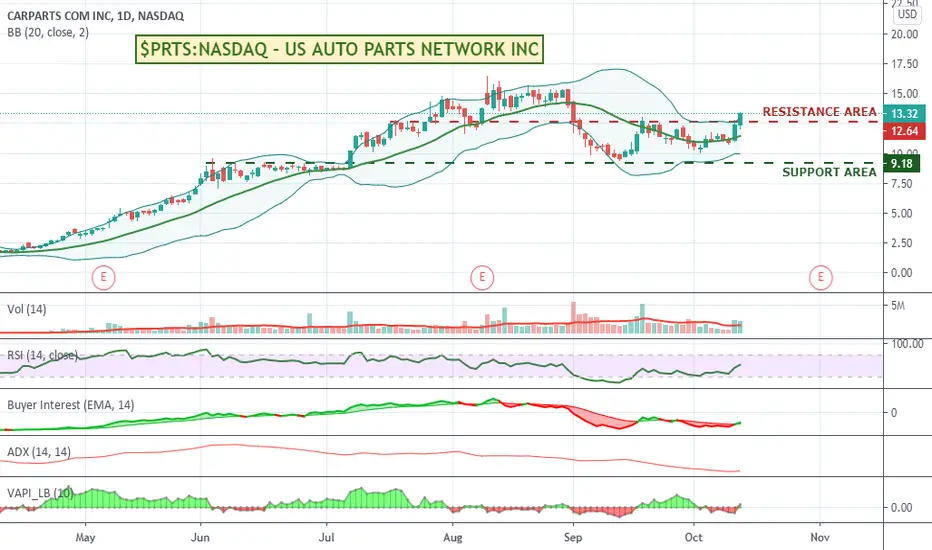
$PRTS:NASDAQ - US AUTO PARTS NETWORK- Bolly break with volumePRTS regaining some of its previous momentum. Bolly breakout over a resistance area with volume building. Could be worth a watch.
Symmetrical Triangle on $PRTS Daily ChartBreakout to the upside anticipated sometime next week (around 5 trading days or less)

PRTS LONG PRTS above 20 EMA going to look for this one to go to the $15 area. If this one does not have a strong move this week will exit.
*NOT INVESTEMENT ADVICE*

PRTS LONGI traded this one on the way up to $15 and I believe this stock just experienced a pull back and it will be on its way back to $15. As always there is risk so manage because as you can see on the chart this chart does form triangles and they can be both good and bad for the bullish movement.
*NOT INVESTEMENT ADVISE*


$PRTS:NASDAQ - US AUTO PARTS - Comeback buy signal ?US Auto Parts was one of the best runners up around 800% since its lows in March before its big pullback. It has had a good last couple of days and the volume and RSI look encouraging. After yesterdays 12% run it might pull back a little, but either way well worth a look again.

PRTS - reversal from here?Looks like possible end of 5 days downtrend here, at 10.71
INternet retailer, car parts.
Can bounce and reverse, watching closely.
Average Buy rating by analysts; Global Internet Traffic at carparts.com hits another All-Time high.

Still here, still bull flaggingPrice action has moved mostly sideways since settling down post earnings.
Seems to be following the diagonally price fork over the channel.
Original Price channel is now highlight by orange and red lines. Currently the price cannot get through the orange line as it moves sideways
Sideways consolidation is still bullish, as time is what will take the PA to the end of the pattern.
I think there will be another retest of the bottom of the pattern before reaching the end.

Yet another Bull Flag; Looking for a breakout.A familiar pattern is repeating itself. After a bit of (expected) volatility it appears PRTS is once again forming a Bull Flag. Earnings were positive.
MA's on the hourly are crossing over and pointing up.
Volume Profile on the shorter term chart is again building it's base at the upper range of the bull flag. These are all patterns we have seen before.
The stock price has had good adherence to the price fork yet again and now appears to be stabilizing within the old price channel which is defnied here as the higher green line and the lower heavy red.
On the Daily chart the RSI support we were tracking before broke lower, but now appears to be in a tight channel created on off the RSI low back in back and the old RSI support (now resistance) Still leading us higher and by no means is the stock overbought anymore.
I feel that as the market itself overall liquidity will be looking for stocks which continue to move, so we will still see some action in PRTS even if the overall indices are a bit flat.

The Bull run is not over. So PRTS survived through earnings. .03 EPS which was better than expected but overall margins and EBITA were all positive. I didn't play it correctly but I like to trade recognizable patterns and thought the day go go a bunch of different ways.
Earning date itself saw a huge spike as high as $16.44 which helped define the top of the price channel. It was sold off pretty heavily but still stayed within its level on the price fork.
Following that we have had two days of good gains on strong volume.
I am curious if the RSI wedge on the daily chart which was broken is now going to be support. Today it actually turned around right on that spot, could be coincidence, needs more tests to see if that's true.
Right now looks like a buy around the original price channel, and certainly the lower green line which has been tested a few times and held.
Currently have no positions. The puts appear to be very illiquid so Im not getting involved with that which would bea normally way for me to play the short side with less risk.
