PYPL target 140-150Very nice declining volume saucer or maybe even inverse H&S here. MACD turning up. cracking through 125 opens the door to 140. possible gap fill to 150, but probably not this week.
PYPL trade ideas

Adding again to my PYPL long positionI think we're getting close to a bigger bullish breakout in PYPL. Adding to my earlier positions.

top view analysis - COIN, FB, PYPL, SAM, SQThis Video covers general views of the above tickers, TOP view analysis (longer term charts) Weekly and daily.

Growth Capped by the 50 Day Moving Average These are 6 randomly selected growth stocks that have been hammered and just rejected off the 50 day moving average yesterday.
Watch for the downside trend to continue in these stocks until they're able to at least breach the 50dma.
The question is do these stocks make higher lows (if the downward trend continues) or lower lows?
IMO if you are a trend follower, you should avoid any stocks on the long side if they look like this (unless you're trying to day trade a bounce).

PyPl isn't bearishI believe that after a hard bear flag, such as seen above that with such a good company with the recent acquisition of square. It will float around this range for a while before it goes up. I'm confident in it going up because more and more I'm seeing contactless payment as an option the more places I visit, not to mention Paypal also has a good history with being used on almost every digital marketplace. Many people also could argue that covid was just a surge for every stock and that some have to drop. I do not because I believe that when everyone was stuck inside many people became aware of incidents such as Gamestop, bitcoin, and many other mentionable stocks/cryptos. With this, all I'm trying to say is that investing has become HUGE, it is more accessible than ever, and it's also paving way for the youth such as Florida's recent bill being passed to REQUIRE students to attend financial literacy to GRADUATE high school. In the future, I plan to seldomly post bear content because I don't like the patterns, and don't have the time for more than one field of financials lol. (sorry for the rant, trying to set a mood for my page and people who see my ideas.)
----
Cheers to financial literacy, and let's GET THIS MONEY

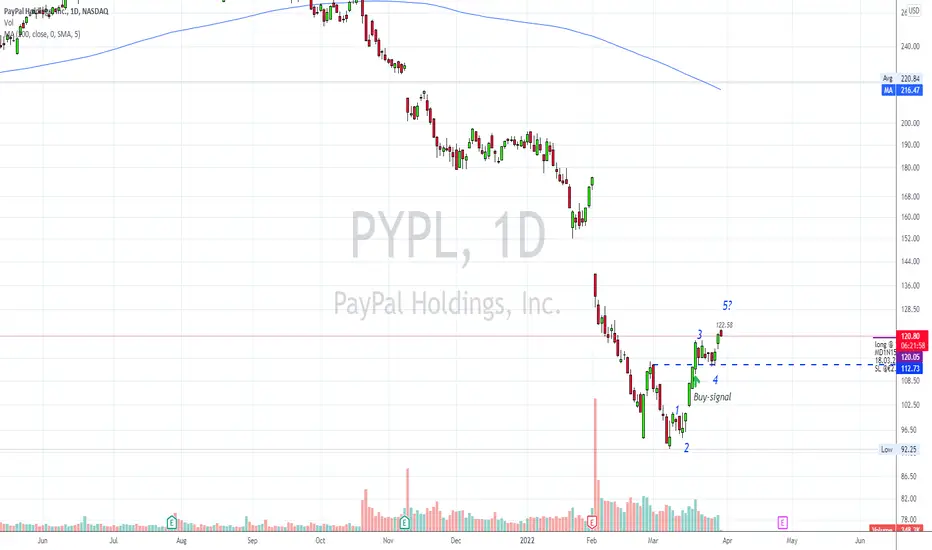
PayPal.....2022-03-31.....Confirmed buy-signal!Hello Traders,
during yesterday's session, PayPal has confirmed the buy-signal, latter week ago.
It runs above the 120.- resistance and close at 121.18 (@Tradingview)!
From trader's view, we face following opportunities.
The high was a wave 1 of a new impulse or it. In this case, a corrective setback is in the cards for the next days, or it will run through new highs and finish the correction at $92.35!
What makes me a bit „patient“ is the volume. Yesterday's move was not confirmed by a massive volume. So this is to watch in the coming one or two days and has to follow.
Any „long-position“ has to be protected with a „stop-loss“ @ $91.35!
Any trading above 111.- will opens the door to ³126.-. More bullish potential exist.
Have a great day....
Ruebennase
Feel free to ask or comment!
Trading this analysis is at your own risk!
PYPL pennantPYPL looking bullish. Nice pennant formed on the daily with strong support established. No reason this shouldn't rip from a technical standpoint. Once the pennant breaks to the upside I'd expect a move to $118 and then $124-125. Volume profile looks really good, not much resistance above $118.

Adding to PYPL longs Adding to PYPL ling positions with stop losses on earlier entries trailed to lock in a net profit.

PYPL RSI convergence PYPL could retest $106 level if a market pullback and could be great play for long run
Below is the link for the trade idea for the week of 03-28-2022 all the content is for information only and it's not trading advice. Trading involves risk
nimb.ws

Paypal setting up for a big breakout! made some nice gains here adding near extreme trend support, sold for profits but I am watching for a break past trend resistance now.
break past 124.31 should send this to 152.28-198.19-254.14

PYPL looks ready to RIPPYPL has a nice setup with a lot of upside. The ripster EMA has turned green, we have had 4 inside days so we have consolidated and formed a new level of support. Looking for a big move tomorrow or next week. PT is $125

Long term buy.Hello traders,
Paypal dropped more as we expected, but now is has bounced off from a MASSIVE weekly support. If we find buy opportunities on the weekly chart, it means it will be a long term trend or more ➡️ an investment which we can hold for months or even years.
Paypal is still a famous payment method and it should not suffer from crisis.
So why we should hesitate ?

Possible Bounce at Long-Term Support TrendlineThis trendline may stop the bloodshed in PayPal. Watching for 120 as first target.

Recap: 3/22 PYPLStrat play 3/25 120c
Setup: 2-1-2 bullish continuation
Actual gain: 1.43 -> 1.44
Theoretical gain: 1.43 -> 1.93
I got in this one and moved my SL to breakeven once the candle closed slightly profitable for my position. Next 5m candle reversed down and took it out.
Didn't enter on re-trigger but that one would've been quite profitable.

Adding some PayPal hereThe daily chart shows the beginning of a downtrend.
Double top cup and handle pattern led to downward momentum from the handle to the 100 week MA.
RSI on the weekly is week. The only other time PYPL has been this week was in March 2020.
News of partnership with AMZN should hopefully ameliorate the drop of eBay.
Adding to PYPL here and holding for the medium term at a minimum.

PYPL trailing stops on longs PYPL up a lot since I bought but struggling at resistance. Locking in long profits with trailing stops.

PYPL 21-03-2022 LongAsset and Time frame -PYPL, Daily
Entry Price -116.21
Exit(Stop Loss) -107.04
Exit(Take Profit) -145.85
Technical Analysis - Price has been down-trending for a while now and started a small consolidation at the bottom, now, the price has breached the 100MA on the 4H chart and the -61.8 level, RSI made a small divergence on the daily chart.
I don't think we'll see a much higher price action moving up, but I think we'll at least retraced back to the -27.2 level,
for those who want a safer entry, I suggest waiting for the 4H candle to close.

PayPal BuyPaypal is another useful company that will have a big rally this year.. Expect all time highs in the future months

$PYPL Looking for a Breakout to fill Gap down from $160+ to $200Let's start with the Tech side of things:
1. Has flipped the PARSAR bullish on the daily and is about to flip it bullish on the weekly
2. Accum/Distri has begun to climb sideways and upwards on the daily and the weekly after being down since Oct last year
3. MACD is been flipped bullish on the Daily and is about to be flipped bullish on the weekly
This is just a few of the technicals that have turned bullish in the last few weeks, there are several more.
Analysts:
1. MoffettNathanson's Lisa Ellis raised her buy recommendation to $190 this past week
2. Deutsche Bank's Bryan Keane raised his buy recommendation to $200
Why are they Bullish?
Keane met with Paypal's CFO John Rainey this past week, following which he wrote that: "Beyond new product initiatives, PYPL also stands to benefit from expanding into China later in the year (catalyst for ) as well as through increased omni-channel capabilities as it integrates card based solutions and Zettle."
Zettle by PayPal is its point-of-sale solution; its maker was bought by PayPal in 2018.
Ellis wrote that she believes the stock is very attractively priced, and that she " upside from the strong U.S. eBay growth (27% in 4Q21), a macro recovery in China and other international markets, and the rollout of new services, including , crypto investing, and bill payment."

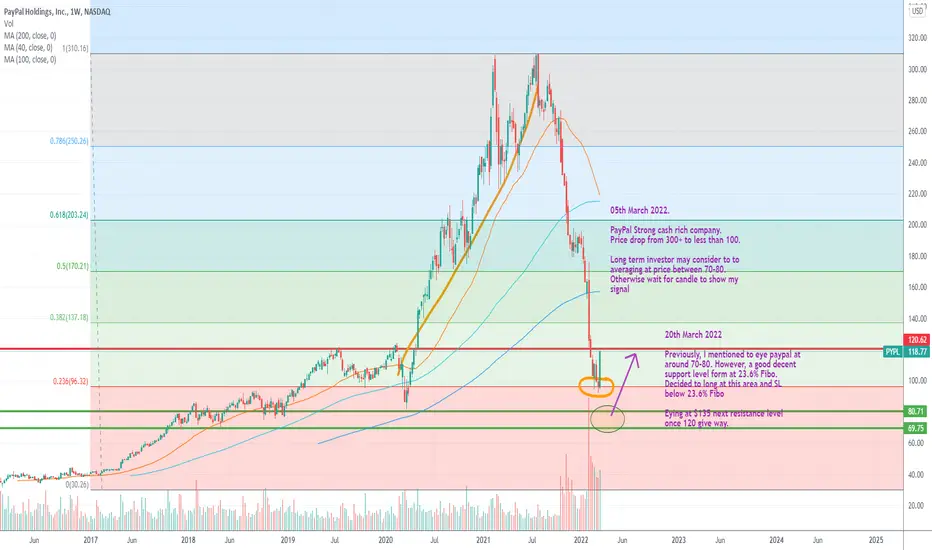
Support at 23.6 Fibo20th March 2022
Previously, I mentioned to eye paypal at around 70-80. However, a good decent support level form at 23.6% Fibo.
Decided to long at this area and SL below 23.6% Fibo
Eying at $135 next resistance level once 120 give way.
$PYPL Bull case.No indicators, what I would like to see from a pure price perspective with the legs up, market may not allow. Void under 116.5 as we go right back into a chop zone.

PAY PALHello everyone, PayPal stock analysis, the stock we found touching the rising trend line as shown in front of you, and by closing this week, I find an opportunity to go up in the stock, but it will be a re-test and this of course depends on the latest events and news.
Here are the levels expected to be reached in the coming period
137.90
152.04
163.47
170.94
It should be noted that there is an interesting resistance area at
180.82: 196.19
By breaking it, we find it at levels
200.62
227.30
Warning, if you decide to enter into a deal, it is your responsibility. This analysis is based on my personal view. God is All-Knowing

PayPal..... The bulls are back!? Massive buy-signal!Hello Traders,
today, I`d like to show you, an opportunity to trade a stock just with the tools of classical chart analysis.
No Elliott waves, no Ichimokou, no nothing.
Who didn't know PayPal, the company which processes payments via the Internet; founded by Elon Musk, among others!?
The stock has fallen down to $92.25 within a „peak“, but closed above the important red trend-line!
This level, what the trend-line marks, was tested several times by market participants and was valid. Last week, the stock bounced again to these levels and reversed sharply this week. On a daily price chart, you will notice the fresh „buy-signal“, PayPal has set yesterday! Supported by a „bullish-engulfing, based on the weekly time-frame! Very strong!
www.tradingview.com
PayPal has moved above the latter high @ $113.54 and closed above this level with a massive bullish candle. That was the buy-signal! How did you know? Watch the candle and the volume that day!
Two things are short-term significant.
a. The stock needs to trade above the low @ $92.25, and
b. A „back-test of the „breakout-level“ should be expected in the coming days or week!
If so to come, and the re-test of these areas will be positive, the door is open to $122.21-124.31!
More bullish potential exist! But let's act „step by step“!
Have a great weekend…..
Ruebennase
Feel free to ask or comment!
Trading this analysis is at your own risk!
The editor is invested in this stock!
