A Success Tunnel for 360 DigiTech: Business TransformationChina's outstanding loan balance reached a fresh record of CNY 172.75 trillion in 2020 and keeps growing, spurred by the increasing digitalization and booming e-commerce market.
In China, 2020 was a milestone year for fintech. The year saw heightened regulatory scrutiny, intensified competition and business patterns were altered by the COVID-19 outbreak, both in the corporate and consumer sectors. The Matthew effect in the industry has been further exacerbated under such circumstances, where small-sized companies with less capital or poor risk resistance ability will be forced to quit the stage.
Although 360 DigiTech, Inc. (QFIN:NASDAQ) is a late starter, it is one of those niche players able to stand up to this fierce competition, mainly due to the reputation of its parent company – 360 Security Technology, Inc. (601360:SH) which brings significant brand visibility to the table.
Strong performance with low valuation
This USD 6.57 billion company is currently outperforming what the market expects. On May 27, 360 DigiTech released its unaudited financial results for the first quarter of 2021. The total net revenue increased by 13.1% to CNY 3.6 billion (USD 0.55 billion) from CNY 3.2 billion in the same period of 2020, while the non-GAAP net income reached CNY 1.41 billion (USD 0.2 billion) with an astonishing increase of 452.8%. The operating income along with the account under the non-GAAP measure achieved a growth of 745.7% and 533.0%, respectively.
However, given this relatively strong financial performance, 360 DigiTech's P/E ratio appears to have been lower than that of its peers for a long time, although it is currently ranked the highest among the top four. Lexin (LX:NASDAQ), a leading online consumption and consumer finance platform, is also using technologies to encompass risk management and loan facilitation systems, just as QFIN does, but its P/E ratio is far higher than that of QFIN. For example, in the third quarter of 2020, Lexin's P/E ratio was more than 5 times that of 360 DigiTech; by Q2 2021, Lexin was lower than 360 DigiTech for the first time, at the level of 8.1. Along with the progressively upward stock price, the necessity of re-assessing 360 DigiTech is becoming more obvious.
How the asset-light business model works
360 DigiTech is one of the earliest platforms in the industry to proactively initiate the transformation of reducing the proportion of self-operated loans and improving loan facilitation. This turned out to be an informed decision.
In the third quarter of 2019, 360 DigiTech first proposed its new strategic target for adopting the 'capital-light,' or more commonly as 'asset-light' business model. More colloquially, this refers to the company directly navigating the borrower to their cooperative financial institution, while collecting service fees from credit evaluation, credit management, or other technical-related services.
According to the published unaudited financial results of 360 DigiTech for the first quarter of 2021, the total loans originated by financial institutions were CNY 74.15 billion, of which CNY 37.25 billion (50.2%) was under an asset-light model and other technology solutions, achieving an astonishing increase of 211.9% over the same period in 2020.
Haisheng Wu, CEO of 360 DigiTech, stated that "...over 50% of the loans were facilitated under the capital-light model and other technology solutions..." and it is a "fundamental change to the nature of our business, from being capital-driven to technology-driven."
The highlight of this model is that as a loan facilitator, the company is not required to inject any margin for each loan. In other words, the credit risk of the asset-light business is borne by the capital; the loan facilitator is thus riskless. Besides, it can better respond to regulatory requirements and resist the impacts of uncertainty on business stability.
Moving further towards 'tech'
In policy terms, the tightening regulatory rules pose a little impact to loan facilitators like 360 DigiTech – even as fintech giants like Ant Group and JD Digits may suffer – as its targets are excess leverage and systematic risks. It creates opportunities for 360 DigiTech to jump a queue. The asset-light model is hence the core strategy of reducing the regulatory and credit risk. Besides, QFIN is trying to use less capital and more technology-powered services to open up more opportunities, both in terms of client acquisition and risk management.
The improved portfolio quality, as indicated by the relatively low delinquency ratio, was one of the contributors for its shining performance even in the special 2020, although it showed an upward-trending slope for the period during the epidemic. However, it seems reasonable: due to the lag of loan repayment as well as its timeliness of statistics, the negative effects of China's -6.8% GDP in 2020Q1 only started to appear in the second quarter of 2020, causing a history of high non-payment ratio of 2.82%. Up to date, the company's delinquency ratio has nearly risen back to the level before COVID-19, and we will keep an eye on its future performance.
Moreover, with a few innovations and technologies, for example, Argus RM Model, Intelligence Credit Engine (ICE), Cloud Bank System, Cosmic Cube System, Apollo Platform and AI Robots, 360 DigiTech is working hard towards the 'tech side' of the fintech business as well as being technology partners with banks. The strategic collaboration with Kincheng Bank (KCB) is a good example.
The bottom line
360 DigiTech's asset-light model works well, and it has the potential to pay off from the long-term perspective, which brings further expectation for its growth prospects. The company's business expansion plans are proceeding with KCB as the first step. These strategies will further improve the company's flexibility in this competition for market share.
Fo rthe full article with chart, please visit the original link
QFIN trade ideas

A Success Tunnel for 360 DigiTech: Business TransformationChina's outstanding loan balance reached a fresh record of CNY 172.75 trillion in 2020 and keeps growing, spurred by the increasing digitalization and booming e-commerce market.
In China, 2020 was a milestone year for fintech. The year saw heightened regulatory scrutiny, intensified competition and business patterns were altered by the COVID-19 outbreak, both in the corporate and consumer sectors. The Matthew effect in the industry has been further exacerbated under such circumstances, where small-sized companies with less capital or poor risk resistance ability will be forced to quit the stage.
Although 360 DigiTech, Inc. (QFIN:NASDAQ) is a late starter, it is one of those niche players able to stand up to this fierce competition, mainly due to the reputation of its parent company – 360 Security Technology, Inc. (601360:SH) which brings significant brand visibility to the table.
Strong performance with low valuation
This USD 6.57 billion company is currently outperforming what the market expects. On May 27, 360 DigiTech released its unaudited financial results for the first quarter of 2021. The total net revenue increased by 13.1% to CNY 3.6 billion (USD 0.55 billion) from CNY 3.2 billion in the same period of 2020, while the non-GAAP net income reached CNY 1.41 billion (USD 0.2 billion) with an astonishing increase of 452.8%. The operating income along with the account under the non-GAAP measure achieved a growth of 745.7% and 533.0%, respectively.
However, given this relatively strong financial performance, 360 DigiTech's P/E ratio appears to have been lower than that of its peers for a long time, although it is currently ranked the highest among the top four. Lexin (LX:NASDAQ), a leading online consumption and consumer finance platform, is also using technologies to encompass risk management and loan facilitation systems, just as QFIN does, but its P/E ratio is far higher than that of QFIN. For example, in the third quarter of 2020, Lexin's P/E ratio was more than 5 times that of 360 DigiTech; by Q2 2021, Lexin was lower than 360 DigiTech for the first time, at the level of 8.1. Along with the progressively upward stock price, the necessity of re-assessing 360 DigiTech is becoming more obvious.
How the asset-light business model works
360 DigiTech is one of the earliest platforms in the industry to proactively initiate the transformation of reducing the proportion of self-operated loans and improving loan facilitation. This turned out to be an informed decision.
In the third quarter of 2019, 360 DigiTech first proposed its new strategic target for adopting the 'capital-light,' or more commonly as 'asset-light' business model. More colloquially, this refers to the company directly navigating the borrower to their cooperative financial institution, while collecting service fees from credit evaluation, credit management, or other technical-related services.
According to the published unaudited financial results of 360 DigiTech for the first quarter of 2021, the total loans originated by financial institutions were CNY 74.15 billion, of which CNY 37.25 billion (50.2%) was under an asset-light model and other technology solutions, achieving an astonishing increase of 211.9% over the same period in 2020.
Haisheng Wu, CEO of 360 DigiTech, stated that "...over 50% of the loans were facilitated under the capital-light model and other technology solutions..." and it is a "fundamental change to the nature of our business, from being capital-driven to technology-driven."
The highlight of this model is that as a loan facilitator, the company is not required to inject any margin for each loan. In other words, the credit risk of the asset-light business is borne by the capital; the loan facilitator is thus riskless. Besides, it can better respond to regulatory requirements and resist the impacts of uncertainty on business stability.
Moving further towards 'tech'
In policy terms, the tightening regulatory rules pose a little impact to loan facilitators like 360 DigiTech – even as fintech giants like Ant Group and JD Digits may suffer – as its targets are excess leverage and systematic risks. It creates opportunities for 360 DigiTech to jump a queue. The asset-light model is hence the core strategy of reducing the regulatory and credit risk. Besides, QFIN is trying to use less capital and more technology-powered services to open up more opportunities, both in terms of client acquisition and risk management.
The improved portfolio quality, as indicated by the relatively low delinquency ratio, was one of the contributors for its shining performance even in the special 2020, although it showed an upward-trending slope for the period during the epidemic. However, it seems reasonable: due to the lag of loan repayment as well as its timeliness of statistics, the negative effects of China's -6.8% GDP in 2020Q1 only started to appear in the second quarter of 2020, causing a history of high non-payment ratio of 2.82%. Up to date, the company's delinquency ratio has nearly risen back to the level before COVID-19, and we will keep an eye on its future performance.
Moreover, with a few innovations and technologies, for example, Argus RM Model, Intelligence Credit Engine (ICE), Cloud Bank System, Cosmic Cube System, Apollo Platform and AI Robots, 360 DigiTech is working hard towards the 'tech side' of the fintech business as well as being technology partners with banks. The strategic collaboration with Kincheng Bank (KCB) is a good example.
The bottom line
360 DigiTech's asset-light model works well, and it has the potential to pay off from the long-term perspective, which brings further expectation for its growth prospects. The company's business expansion plans are proceeding with KCB as the first step. These strategies will further improve the company's flexibility in this competition for market share.

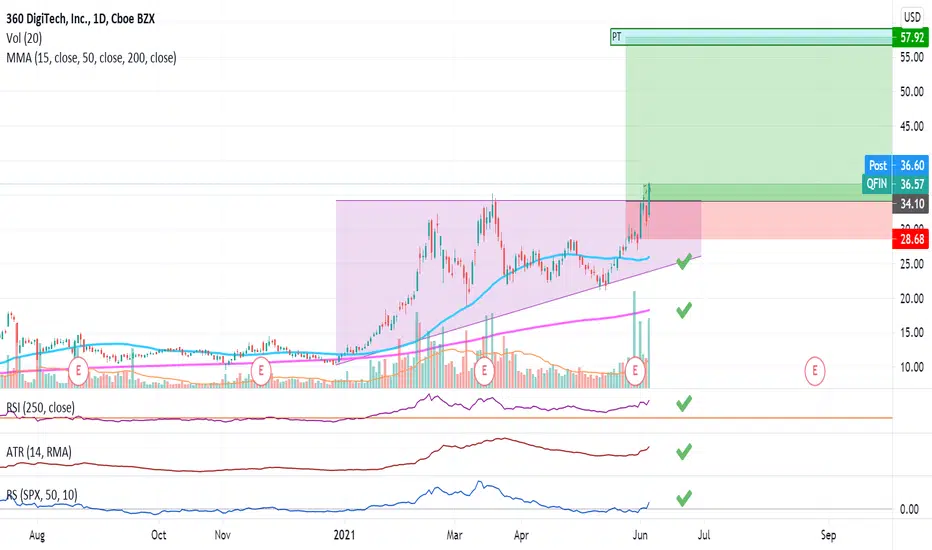
QFIN, Strong decilne is on the way !QFIN more than likely has completed a 5 wave motive rally and a high probability decline is on the way soon.
Motive 5 wave rally was started from 6.37 USD on Mar 18th 2020 and made a huge progress up to 45 USD terminated on June 17th 2021.
Price reacted well and beautifully to strong resistance at 45 USD consisting of 1.618 extension of wave 4 and 0.786 Fibo projection of wave 1-3.
If true , decline to 30, 25,20 and 14 USD corresponding to 0.382 , 0.5 , 0.618 and 0.786 Retracements of mentioned rally is possible for now. Later we can choose among these Retracement levels based on internal structure of upcoming corrective wave.
Stochastic indicator has already made a bearish reversal in daily time frame while it is in overbought zone in weekly. It suggests that 45 USD all time high may remain the last high for several weeks.
My Recommendations:
1- If you are in the trade and you doubt about this analysis, use Multi Unit Trade Strategy and save some profits. It is a very powerful tool for risk management.
2. If you want to go long, Its is wise to wait for a correction completion. It is too risky to go long now. Trade smartly.
Good luck everybody.

QFINBreakout - Broke 50Ma and closed above MPivot. I believe we have an AB=CD. Thoughts always appreciated ...


QFIN about to go parabolicQFIN with consistent annual revenue, MACD crossing upward in the weekly, Huge volume, RSI about to go to overbought.

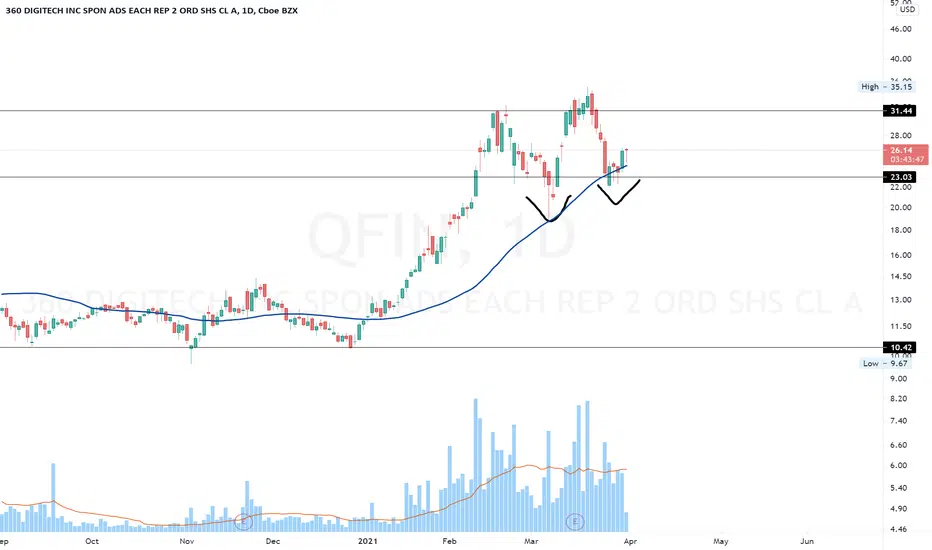
QFIN - The Upstart of China?Watch for the break above the 50 day moving average of the Nasdaq, QFIN has formed a double bottom and is looking for continuation onto the upside!
QFIN for the bounces and long haul.5/5/2021 QFIN 15 minute with 30 day MVWAP from Lazybear. Consolidation in QFIN is taking place. Get on board if you like.

QFIN (360 DigiTech) - Bullish quarter end360 DigiTech Inc. provides data driven, technology empowered digital platform. 360 DigiTech Inc., formerly knonw as 360 Finance Inc., is based in SHANGHAI, China.
Analysis/Commentary
Good EPS and Sales Growth Y-on-Y
Based on the study of the previous quarterly earnings reports and subsequent price moves:
- Current quarter has given price move within LOW - MID point
- Entry should be initiated at this point
- Expectation for the price to move to MID or HIGH point
- Trailing stop-loss on price above MID point
GOOD LUCK.
DO YOUR OWN RESEARCH!

$QFINEntry price : 28.67
Fundamentals :
- Sector: Finance
- EPS % Chg (Last Qtr): 70%
- EPS % Chg (Previous Qtr): 38%
- 3 Year EPS Growth Rate: 351%
- EPS Est % Chg (Current Yr): 34%
- Sales % Chg (Last Qtr): 51%
- Sales % Chg (Previous Qtr): 46%
- 3-Year Sales Growth Rate: 192%
- Annual Pre -Tax Margin: 34.9%

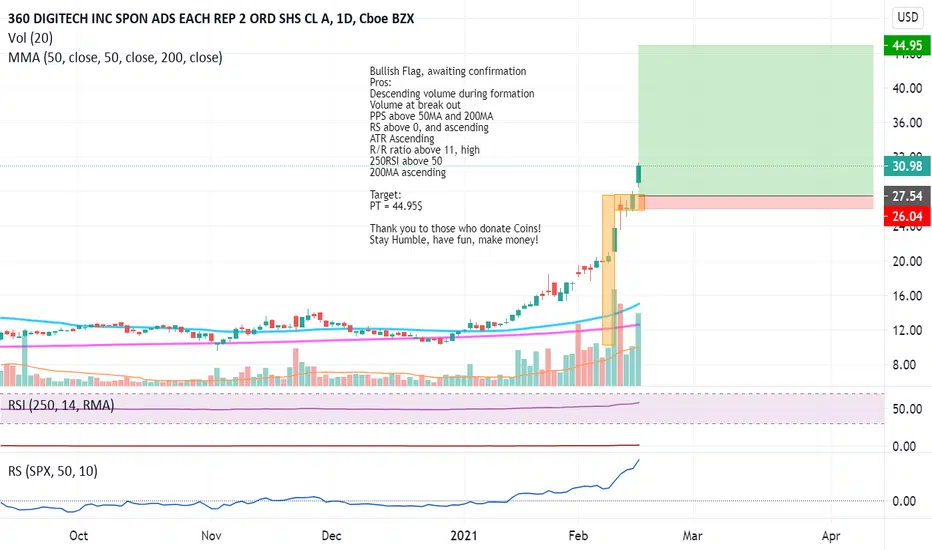
QFIN: Bullish Flag, awaiting confirmationBullish Flag, awaiting confirmation
Pros:
Descending volume during formation
Volume at break out
PPS above 50MA and 200MA
RS above 0, and ascending
ATR Ascending
R/R ratio above 11, high
250RSI above 50
200MA ascending
Target:
PT = 44.95$
Thank you to those who donate Coins!
Stay Humble, have fun, make money!

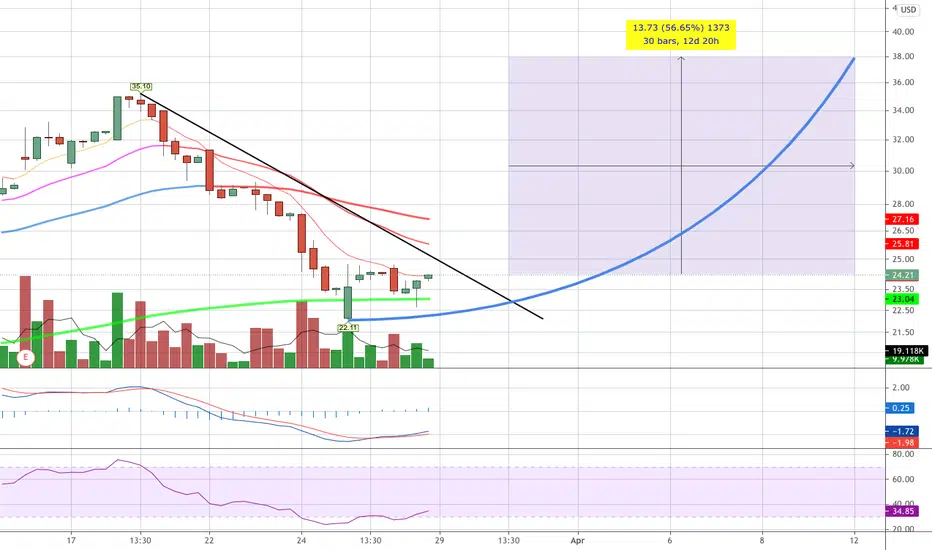
QFIN Fisher going on a weekly 5$ candle?here are my minimum prerequisite on a weekly chart
Fisher transform Positive and climing on weekly
3&8 ema + on Weekly
3&8 ema + on 3 Days
8&34 ema + on 178 MIN
Some basic E.W. to match
Weekly pivot respected
Wrong analysis if break 17.00 again in my books because wave 3 cannot retrace to wave 1


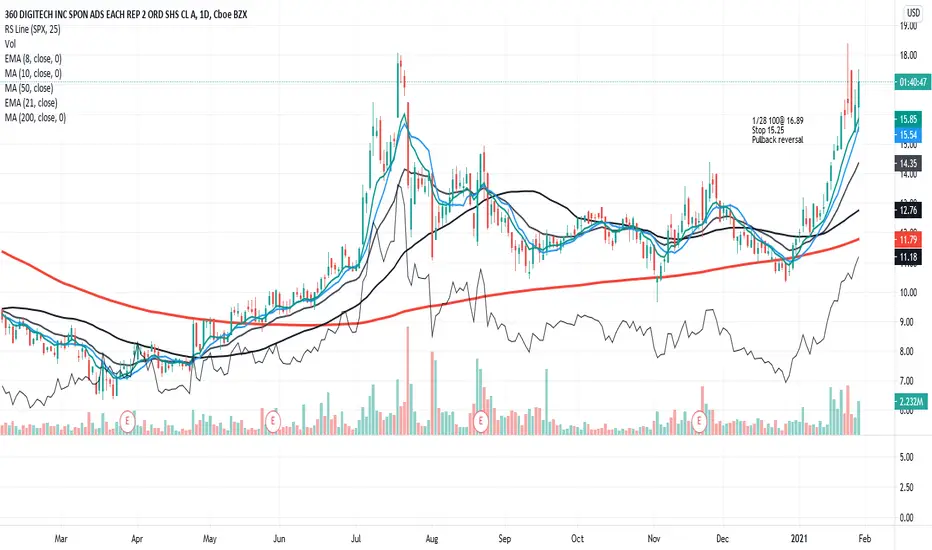
$QFIN Great Relitive Strenght /Breakout Pullback$QFIN Look at how this one held up yesterday while he market was in decline. This tells me that this stock is in demand. I've started about a 1/3 position. You can see my entry and stop on the chart. This gets a short leash as it's not the best pattern to trade, but I like the overall set-up. Ideas, not investing / trading advice. Caution is also warranted as IBD has downgraded the market to "Sideways Action."
QFIN breaking out and is looking promisingNASDAQ:QFIN is breaking out, long any pullbacks to target 18.09$, 18.97$, sell zone between 21.3$ and 22.15$ and 24.4$. IMO this a good stock for long term.
Hit the like button and follow if you find this useful :)
This is only my own view and not financial advice, do your own analysis before buying or selling
Happy Trading!


QFINNASDAQ:QFIN
QFIN Q3 Earnings Analysis: https:///xueqiu.com/9598793634/163830500
Mid term target $17 - $20

360 FINANCIAL LONG OPPORTUNITYSweet find here. Strong financials and miss-priced to the sector. Targeting 17+
Total loan origination volume was RMB58,905 million, representing an increase of 21.8% from RMB48,378 million in the same period of 2019. Loan origination volume under capital-light model within Platform Services was RMB14,616 million, an increase of 282.3% from RMB3,823 million in the same period of 2019.
Total outstanding loan balance was RMB78,480 million as of June 30, 2020, an increase of 28.0% from RMB61,289 million as of June 30, 2019. Outstanding loan balance under capital-light model within Platform Services was RMB18,840 million as of June 30, 2020, an increase of 438.9% from RMB3,496 million as of June 30, 2019.
The weighted average tenor of loans originated in the second quarter of 2020 was approximately 8.54 months, compared with 7.76 months in the same period of 2019, and 8.18 months in the first quarter of 2020.
Cumulative registered users was 148.98 million, an increase of 36.3% from 109.28 million as of June 30, 2019, and an increase of 5.2% from 141.63 million as of March 31, 2020.
Users with approved credit lines was 27.71 million as of June 30, 2020, an increase of 44.1% from 19.23 million as of June 30, 2019, and an increase of 6.1% from 26.11 million as of March 31, 2020.
Cumulative borrowers with successful drawdown, including repeat borrowers was 17.77 million as of June 30, 2020, an increase of 41.7% from 12.54 million as of June 30, 2019, and an increase of 5.7% from 16.81 million as of March 31, 2020.
90 day+ delinquency ratio was 2.82% as of June 30, 2020.
The percentage of funding from financial institutions in the second quarter of 2020 was 98%.
Repeat borrower contribution was 86.4%.
Total net revenue increased by 50.0% to RMB3,340.1 million (US$472.8 million) from RMB2,226.9 million in the same period of 2019.
Income from operations increased by 19.7% to RMB993.2 million (US$140.6 million) from RMB829.6 million in the same period of 2019.
Non-GAAP income from operations increased by 17.2% to RMB1,058.9 million (US$149.9 million) from RMB903.2 million in the same period of 2019.
Operating margin was 29.7%. Non-GAAP operating margin was 31.7%.
Net income increased by 41.8% to RMB876.5 million (US$124.1 million) from RMB618.2 million in the same period of 2019.
Non-GAAP net income increased by 36.2% to RMB942.1 million (US$133.4 million) from RMB691.7 million in the same period of 2019.
Net income margin was 26.2%. Non-GAAP net income margin was 28.2%.

STOCK ALERT 🚨 QFINRSI - Bullish
MACD - Bullish
Trend - Bullish
Pattern - Bullish
Continuation Imminent
Targets marked at 23-27$
Do your own homework. Been doing this for years myself. Yes I put 5k on this one so I’m pretty confident!
