$QQQ Trading Range for 7.21.25 and everything in itToday’s Trading range and everything in it. How are you playing it?
QQQ trade ideas
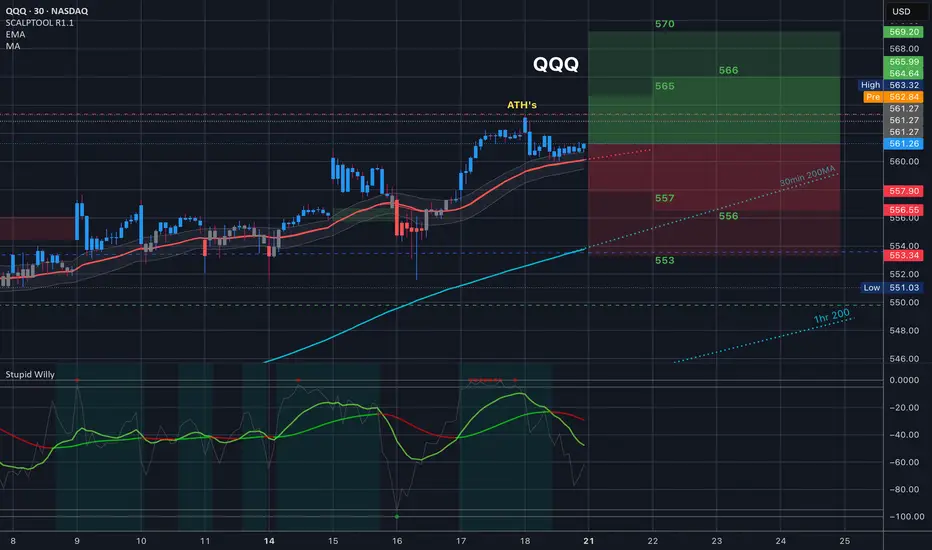
$QQQ this might the spot. Hello and good night, evening, afternoon, or morning wherever you may be. I have been looking at names all day and I wanted to check the indexes: NASDAQ:QQQ and $SPY.
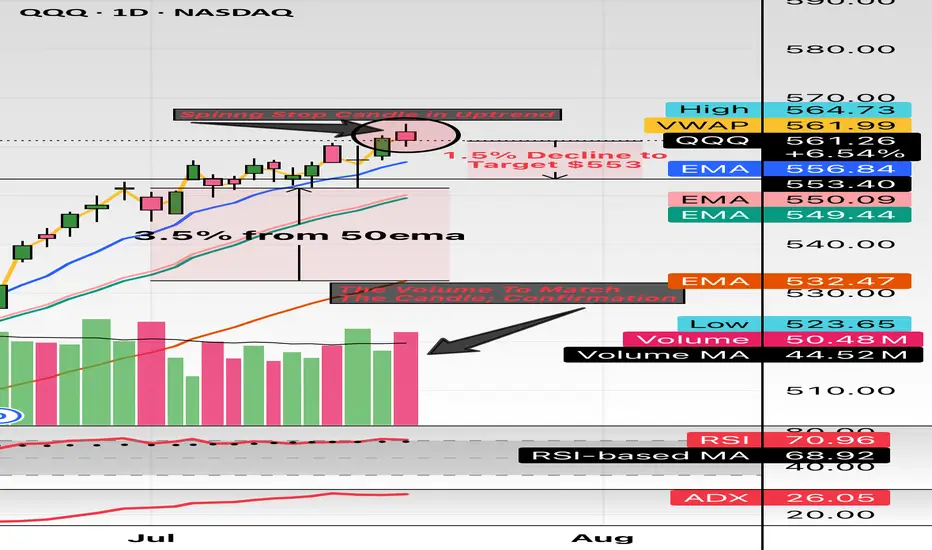
Here we have the indexes up almost 30% from the April lows and sitting about 10% YTD. The candle highlighted is the spinning stop candle and has volume to match. These candles usually take place (green or red) in downtrends or uptrends and provide pivotal indication. The market has major earnings this week (07/21/2025 to 07/25/2025) with names like Google, Tesla, General Dynamics, Verizon, Domino’s And so forth.
This week could be a catalyst to see some great volatility. I believe staying 3% from moving averages so I have noted 3.5% from the 50EMA and revisiting the 20EMA and 21EMA in the low $550 area. My target is $553 which is only a 1.4% move which can happen in one session in this environment while staying 3.5% above the 50EMA.
My trade idea will be $553p for 07/25/2025. Good luck!
WSL
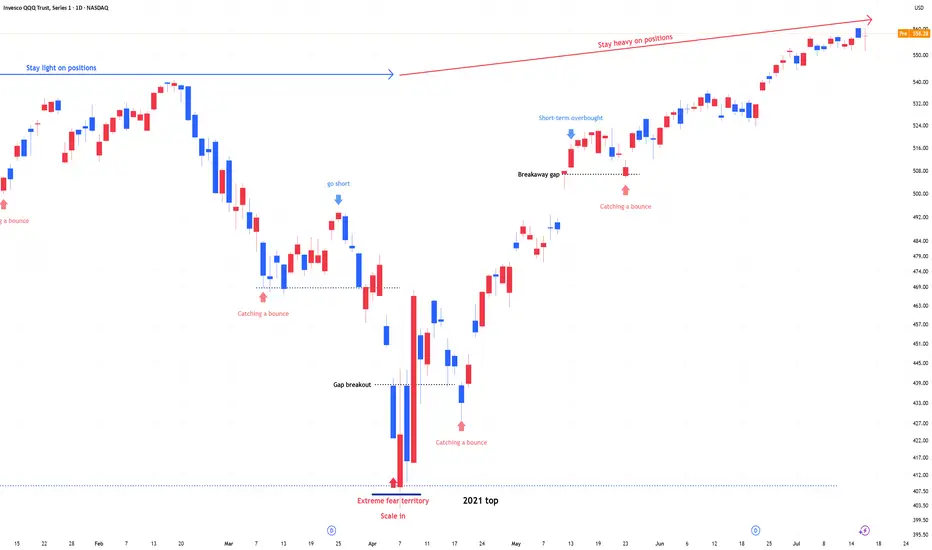
QQQ : Stay Heavy on Positions1) April Fear & Buy Signals
In early April, the Nasdaq 100 experienced a sharp sell-off, triggering extreme fear sentiment across the market.
At that point, scale-in buy signals appeared—classic "buy the fear" conditions.
2) Current Market State: No More Fear, but Watching
Since then, the market has stabilized.
The fear has disappeared, but we are still in a wait-and-see mode as traders assess the next move.
Momentum is holding, but participation remains cautious.
3) Stay Heavy on Positions
Despite short-term uncertainty, I’m maintaining an overweight position on the Nasdaq 100.
As long as we don’t see a major breakdown, the bias remains bullish.
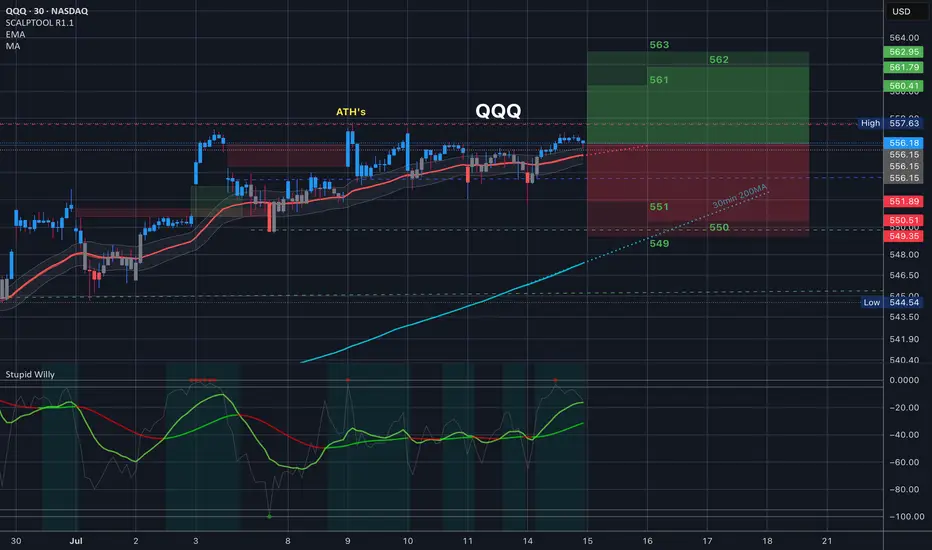
$QQQ Trading Range for 7.15.25 and everything in it for CPI
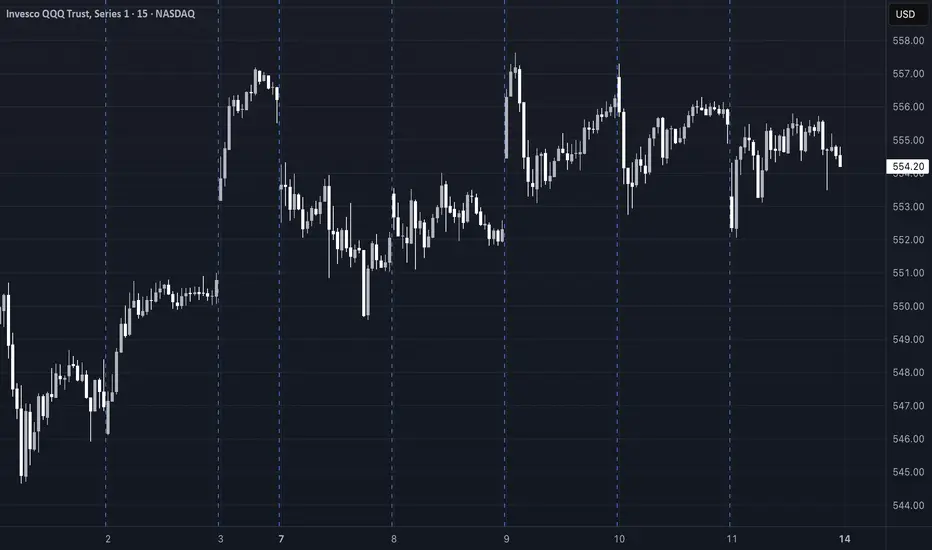
Tomorrow’s Trading range and everything in it. We have CPI in premarket tomorrow. This is the trading range. let's go.
$QQQ Tomorrow’s Trading Range and everything in it /// 7.14.25Tomorrow’s Trading range and everything in it. How are you playing it?
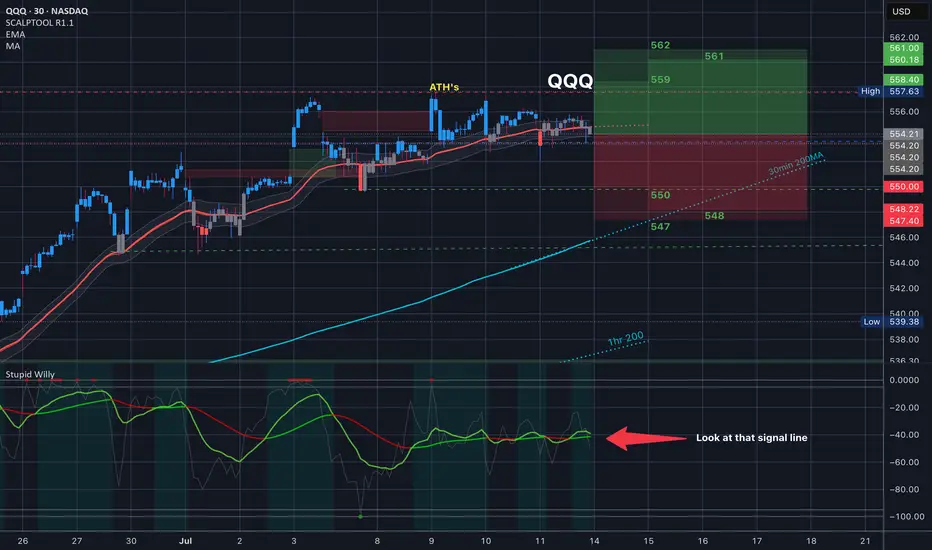
QQQ July 14th 2025I failed to update my trade journal at the end of last week and am going to try to be better about it this week. I am going to try to keep these posts more brief so I can remain consistent and meet my goal of creating an accurate timeline of my trades. For this week, I am going in with a bullish bias, which is better supported on the PA for NASDAQ:QQQ instead of AMEX:SPY , so I will be trading it instead.
The price is currently down 0.60% overnight, which would take the price near the bottom of the range ($550), which is outside of the channel. In this flat structure, we will either see the price break up after a liquidity test (spring) or break down in a true bearish reversal.
+++++++++++++++++++++++++++
Neutral Analysis
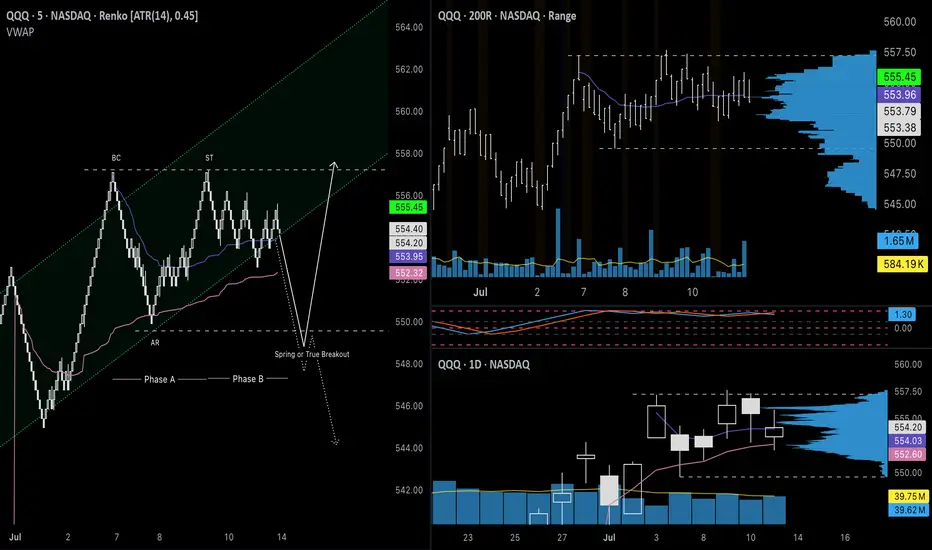
Renko: As my main chart, Renko clearly shows both scenarios, illustrated by the solid white (bullish) line and the dotted (bearish) line. For the bullish idea, the price will find a significant number of buyers after a false breakout to the downside. I switched from Traditional box sizes to ATR (14) filtered, and as you can see, the automatic rally (AR) after the peak did not have a significant retracement. We did not see a retest of the upper part of the range that could be considered a secondary test (ST) until some time later and when it did, the price rose back to the peak, indicating that buyers still had strength. From there, the price has been chopping around in Phase B without making much progress to the downside, which it will most likely reach on Monday in the form of a gap down. Additionally, the rising channel that led to this pullback is also a strong pattern, so this pullback should be treated as possible re-accumulation. If the price fails to reenter the channel or reach the top after a breakout below the range, it will likely sell off from there.
200R Chart: The range chart also supports that the secondary test was the retest of the top of the channel, a potential sign of strength. The price is still way above the 200MA, so the uptrend appears strong. One important area to watch is the volume gap from $548-$549 on the volume profile. If bulls cannot defend the gap, that could be a potential sign of weakness.
500R Chart: I am including this chart because it does provide a reason to be cautious of a pullback, or even a reversal. The price is at the top of the channel that began on April 9th. The last time the price tested the upper boundary, it formed a temporary top and pulled back, which we could see play out again here. The volume candles also show significantly higher interest since May 13th. This could either be due to increased interest from buyers or the distribution of shares, requiring more effort to move the price higher.
Daily Chart: Here is another chart that suggests that the first movement that could be considered a secondary test was the retest of the top of the range. The price has been bouncing off monthly VWAP and Fisher Transform remains flat in the upper zone. We have not seen a bearish candle with intent on the daily chart. These have all been flat doji candles.
Options: For this section, I can’t provide a good analysis of on-the-money options since the price is likely to gap down. I’m including 7/15 $550p since the price will likely open around that level and will need to move below the strike to see the premium rise significantly. The price of this contract was in a larger descending channel and will need a strong break above the top ($2.15) in order to signal further downside for $QQQ. According to my options calculator, this would require the underlying price to drop below $551 for an extended period.
+++++++++++++++++++++++++++
Targets
Calls: Open at $549; Close at $557; Stop below $548
Puts: Open $550-$552; Close at $544.50; Stop above $555
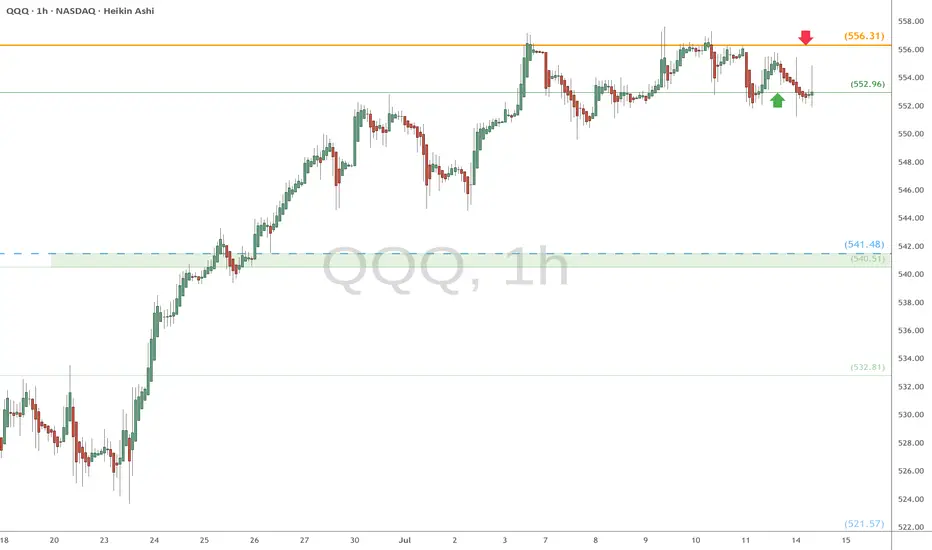
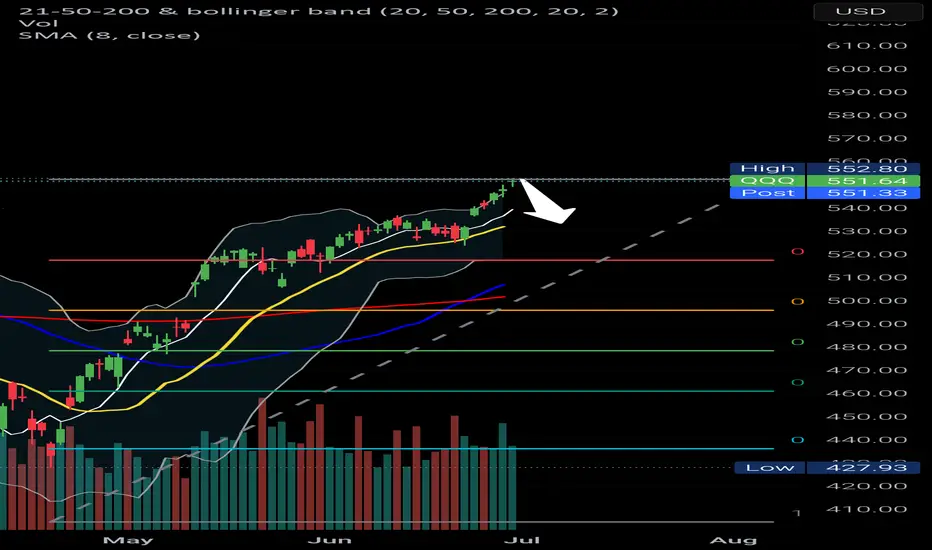
QQQ watch $556.31 above 552.96 below: Break of either should RUNQQQ (Nasdaq) has flown off the bottom like a rocket.
Now up against a Golden Genesis fib at $556.31.
Local support fib from bottom is below at $552.96.
Break of either should result in a strong next leg.
Next decent support below is at $54.51-541.58
============================================
.
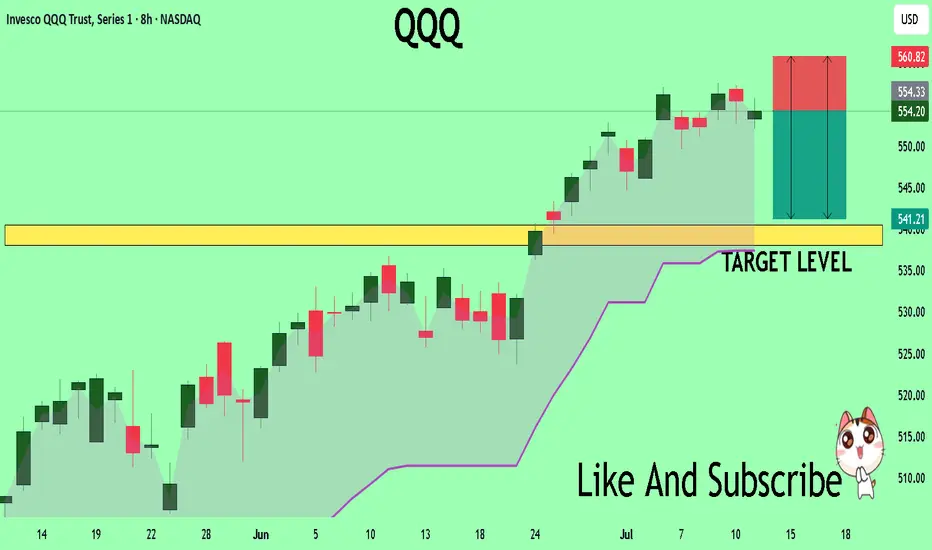
QQQ What Next? SELL!
My dear followers,
I analysed this chart on QQQ and concluded the following:
The market is trading on 554.20 pivot level.
Bias - Bearish
Technical Indicators: Both Super Trend & Pivot HL indicate a highly probable Bearish continuation.
Target - 540.50
Safe Stop Loss - 560.82
About Used Indicators:
A super-trend indicator is plotted on either above or below the closing price to signal a buy or sell. The indicator changes color, based on whether or not you should be buying. If the super-trend indicator moves below the closing price, the indicator turns green, and it signals an entry point or points to buy.
Disclosure: I am part of Trade Nation's Influencer program and receive a monthly fee for using their TradingView charts in my analysis.
———————————
WISH YOU ALL LUCK
Inevitable Pull Back Coming Soon? | NVDA TSLA AAPL AMZN META MSFStock Market Forecast | CME_MINI:ES1! CME_MINI:NQ1! SPY QQQ
Mag 7 Forecast | NASDAQ:NVDA NASDAQ:TSLA AAPL AMZN META MSFT July 2025 Forecast

The Myth of Win RateOne of the most common questions I get from QS members:
“What’s the win rate of the signal?”
Sounds like a smart question. But it's often coming from the wrong mindset — the same mindset as a student cramming for a test, hoping for one perfect answer key that’ll give them a 90% score and an easy win.
Let me break this down for you:
🧮 The Only Two Numbers That Matter in Trading
There are only two math truths that actually grow your account:
Win Rate – how often you’re right
Win/Loss Ratio – how much you make when right vs. how much you lose when wrong
Everyone obsesses over #1.
Almost no one truly understands or applies #2 — and that’s the real killer.
---
🤔 So What’s the Ideal Setup?
In a perfect world, you’d have:
A high win rate (80–90%)
AND a high win/loss ratio (make $3, lose $1)
But guess what?
This isn’t a perfect world — this is a war.
See my earlier post: "What’s your catalyst?"
---
⚔️ Trading Is Like War (or Sports)
In war, victory is rare and costly.
In sports, scoring takes hard work, timing, and discipline.
In trading:
You win big when the odds are stacked in your favor
You cut losses quickly when you’re on the wrong side
That's the gold standard — but few do it.
Even worse, many do the exact opposite:
Take quick profits to “lock in a win”
Let losers run hoping for a miracle
Then they wonder why their account bleeds over time.
---
🎰 Vegas Was Built on 51% Win Rate
Casinos don’t need to win every game. They just need:
Slightly better than 50% edge
Strict control over risk and payout
That 1–2% edge? It built every billion-dollar casino on the Strip.
Now think again:
Why are you chasing a 90% win rate when even 55% + smart risk control can make you rich?
---
🧠 Profitability > Win Rate
You don’t need to win all the time.
You need to win big enough and lose small enough.
Your goal should be:
3 steps forward, 1 step back.
That’s the realistic rhythm of trading success.
---
✅ So Next Time You Ask About a Signal...
Don’t just ask:
“What’s the win rate?”
Instead ask:
“What’s the reward if I’m right?”
“What’s the damage if I’m wrong?”
“How do I size this trade so my wins outgrow my losses over time?”
This is how real traders think.
Not about perfection — but about probability, edge, and sustainability.
---
💬 TL;DR
Win rate is just one piece.
Your win/loss ratio and risk management matter more.
Profitability > accuracy.
The market doesn’t reward perfection. It rewards preparation, defense, and discipline.
Keep playing smart, not perfect.
And remember — it’s a long game. 🧠📈
$QQQ Tomorrow’s Trading Range and everything in it /// 7.10.25
Today’s Trading range and everything in it. How are you playing it?

$QQQ Tomorrow’s Trading Range and everything in it /// 7.8.25Tomorrow’s Trading range and everything in it. How are you playing it?

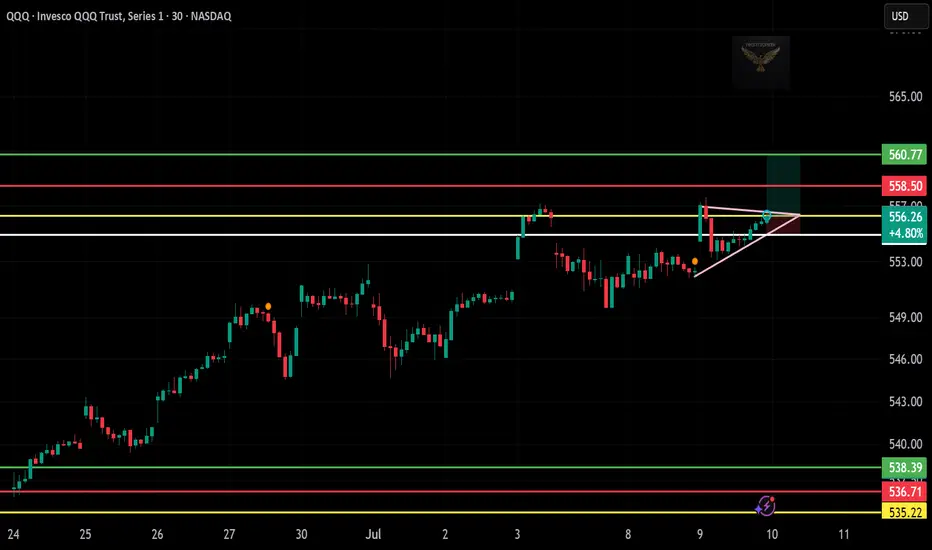
$QQQ Long Trade Setup – July 10📈
Price formed a tight triangle right at resistance—and today we got the breakout. Looks ready for continuation if volume steps in.
📌 Entry: $556.26
🎯 Target: $560.77
🛑 Stop Loss: Below $554.00
⏱️ Timeframe: 30-min chart
🔍 Why I Like This Trade:
Strong bullish flag breakout after retest
Holding above structure with higher lows
Clean path toward the upper resistance zone
🧠 This setup aligns with the overall tech strength—riding the momentum with tight risk!
$QQQ – Fibonacci Roadmap to 700+ | VolanX Macro ProjectionPosted by WaverVanir International LLC | July 7, 2025
We're now entering a potentially historic expansion phase in the $QQQ. Our macro model, embedded in the VolanX DSS framework, projects a highly probable move toward the 1.786–2.0 Fibonacci extension zone, targeting $696.80 to $739.27, with 711.45 as a primary convergence level.
🔍 Key Technical Breakdown:
📐 Measured Move Base: November 2023 to March 2025 low
🟡 Fib Anchors: 404.65 low ➜ 540.81 high
🧬 Primary Support Zone: 0.5–0.618 retracement (449–465) held structurally during Q1 volatility
🚀 Resistance Breakout: Sustained break above 540.81 initiated the next Fibonacci leg
📈 Next Major Extension Target:
1.618: 663.46
1.786: 696.80
2.0: 739.27
🎯 Projected Path: Consolidation near current highs, followed by a liquidity-driven breakout into 700+ by mid-2026
🧠 Macro Context via VolanX Alpha Layer:
Liquidity Regimes: Improving risk-on flows with tech sector leadership resurging
AI & Infrastructure Megatrend: QQQ components benefit directly from AI adoption, infrastructure stimulus, and cloud capex
Volatility Compression: VIX continues to trend lower, fueling breakout setups on high beta indices
📊 Strategy Insight – VolanX DSS Signal:
✅ Long bias remains intact while price holds above 528 (last microstructure support)
🔄 Optimal entry zones: Dips toward 540–545 = reload opportunities
⏱️ Swing horizon: 4–6 months
🛡️ Risk Management: Invalidate long thesis on weekly close < 504
📌 Note: This projection is derived from our institutional Decision Support System (DSS), blending Fibonacci confluence, macro catalysts, and structural flows.
🔔 Follow @WaverVanir for more high-conviction macro setups powered by VolanX Protocol.

QQQ Massive Short! SELL!
My dear subscribers,
QQQ looks like it will make a good move, and here are the details:
The market is trading on 556.22 pivot level.
Bias - Bearish
My Stop Loss - 564.94
Technical Indicators: Both Super Trend & Pivot HL indicate a highly probable Bearish continuation.
Target - 542.15
About Used Indicators:
The average true range (ATR) plays an important role in 'Supertrend' as the indicator uses ATR to calculate its value. The ATR indicator signals the degree of price volatility.
Disclosure: I am part of Trade Nation's Influencer program and receive a monthly fee for using their TradingView charts in my analysis.
———————————
WISH YOU ALL LUCK

The Mag 7 over a yearThis chart tracks the Mag 7 over 1 year:
Amazon
Apple
Microsoft
Google
Tesla
NASDAQ
In general, the SPY has gone up to all time highs, so has the NASDAQ but some individual players in Mag7 haven't.

QQQ: Expecting Bearish Movement! Here is Why:
The price of QQQ will most likely collapse soon enough, due to the supply beginning to exceed demand which we can see by looking at the chart of the pair.
Disclosure: I am part of Trade Nation's Influencer program and receive a monthly fee for using their TradingView charts in my analysis.
❤️ Please, support our work with like & comment! ❤️

QQQ: Scaling Recursive PatternsSo far the closest recursive pattern that can mimic current growth would be shape of expansion after covid crash. In both cases the fall was sharp that caused it grow in distinctive way, so we can grab the cycle of the pattern. To keep it simple for this structure, crossing curve would be first sign that price breaks out of regular rhythm and might dive sooner. Added other related patterns:

QQQ A Fall Expected! SELL!
My dear subscribers,
This is my opinion on the QQQ next move:
The instrument tests an important psychological level 548.21
Bias - Bearish
Technical Indicators: Supper Trend gives a precise Bearish signal, while Pivot Point HL predicts price changes and potential reversals in the market.
Target - 535.27
About Used Indicators:
On the subsequent day, trading above the pivot point is thought to indicate ongoing bullish sentiment, while trading below the pivot point indicates bearish sentiment.
Disclosure: I am part of Trade Nation's Influencer program and receive a monthly fee for using their TradingView charts in my analysis.
———————————
WISH YOU ALL LUCK

QQQ 30/04/2025 ShortFailure to break back inside the ascending channel
IMO going down to form a double bottom 410$

QQQ Nasdaq 100 Year-End Price Target and Technical Rebound SetupIf you haven`t bought the previous oversold area on QQQ:
Now the Nasdaq-100 ETF (QQQ), which tracks the performance of the largest non-financial companies in the Nasdaq, has recently entered oversold territory, suggesting that a technical rebound may be imminent. Similar to the Russell 2000, QQQ has experienced significant selling pressure, driving key technical indicators into oversold zones and creating favorable conditions for a bounce.
The Relative Strength Index (RSI) has dropped below 30, a level that typically signals oversold conditions and the potential for a reversal. Additionally, QQQ is trading near key support levels, with a large portion of its components underperforming their 50-day and 200-day moving averages — a classic setup for a mean reversion rally.
From a historical perspective, QQQ has shown a tendency to rebound strongly after similar oversold conditions, particularly when macroeconomic factors stabilize and buying pressure returns. Given the current technical setup, my price target for QQQ is $550 by the end of the year. This represents a recovery of approximately 8-10% from current levels, aligning with previous post-oversold rallies in the index.
While downside risks remain — including potential volatility around Federal Reserve policy and broader economic data — the technical backdrop suggests that QQQ is well-positioned for a recovery in the coming months.

Qqq short Qqq short 532
Bounce LH and another dump
No need to complicate things too much .
Good luck
Triple Top on QQQAs I said some the same things for the S&P 500 . here we have QQQ . Repeating this pattern staying In this box for some time now. investment accounts , 401ks, real estate , etc etc. I see all accross the board people buying almost everything at very high prices. With no in dept look . lets try and make sense of this in market terms. The stock market is not in correlation with the economy say it with me 3 times please. now the level has been met since December 2024. and every single time we create a gap and fall from there now honestly I can see a wall of support is being built but after July please watch out from there. a lot of war money coming into the market
