QQQ Consolidating at Key Resistance! Will Momentum Push It Highe
30-Minute Timeframe Analysis
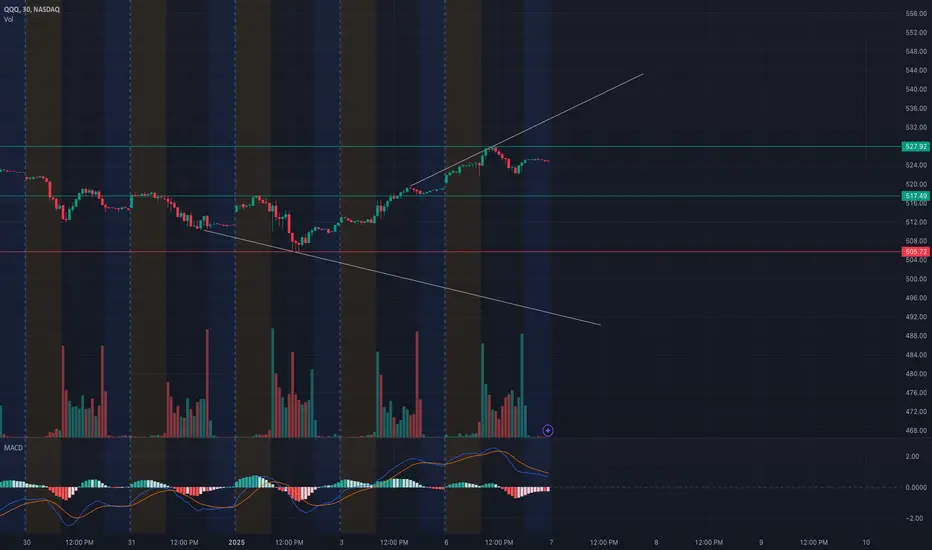
* Trend Overview: QQQ is showing strong recovery, trading near $527.92 resistance after a breakout from a descending trendline. The price is consolidating, indicating indecision at current levels. The possibility of a market gap up or down at the open may change this structure, so traders should remain flexible and reassess their plans accordingly.
* Key Levels:
* Support: $517.49 and $508.20 are critical levels to hold if the price pulls back, particularly during a gap down.
* Resistance: $527.92 and $531.21 are key levels for further bullish momentum, especially if the market gaps up.
* Indicators:
* MACD: Bullish but flattening, signaling potential consolidation unless a gap up drives renewed momentum.
* Volume: Recent volume surge supports upward movement, but a breakout needs confirmation with sustained volume.
1-Hour GEX (Gamma Exposure) Insights
* Key Gamma Levels:
* Positive GEX: $527 and $531 are strong call resistance levels, with $527 serving as the highest positive gamma wall. A gap up may lead to a test of these zones.
* Negative GEX: $523 and $521 are key put support levels, protecting the downside if the market gaps down.
* Options Metrics:
* IVR: Low at 17, reflecting a calm market environment with potential for sudden moves.
* Calls vs. Puts: Slightly bearish skew with puts at 2.5%, signaling mild caution.
* Actionable Gamma Zones:
* Bullish Scenario: Sustained move above $527.92 or a gap up could lead to a rally toward $531.21 or higher.
* Bearish Scenario: A gap down below $523 could activate put support and drive the price toward $517.49.
Trade Scenarios
* Bullish Setup:
* Entry: Break and hold above $527.92, or after a gap up that sustains above $528.
* Target: $531.21 and $535.00.
* Stop-Loss: Below $525.00.
* Bearish Setup:
* Entry: Breakdown below $523.00, or after a gap down that fails to reclaim $524.
* Target: $517.49 and $515.00.
* Stop-Loss: Above $526.00.
Important Note for Traders
* Market gaps at the open can significantly alter the current outlook. Reassess price action during the pre-market session and adjust your strategy to align with updated conditions.
* If you need technical analysis for QQQ or any other stock, feel free to contact me for personalized and detailed insights.
Disclaimer: This analysis is for educational purposes only and does not constitute financial advice. Please conduct your research and trade responsibly.
QQQ trade ideas
QQQ Buy/Reversal to 526 Sell to 497Downwards trend Channel which Upwards Started at 497 Support. While we remain inside the trend channel, look for a break above 519 level and retest for a buy up to 526 and Take Profit. Watch for reversal at 526 , break and retest 526 to consider more trending upward movement. Reversal at 526 we Sell Down to 497 For the Rest of the week .

Stock Market | TSLA NVDA AAPL AMZN META GOOGL MSFTStock Market | TSLA NVDA AAPL AMZN META GOOGL MSFT

QQQ 1-Hour Technical Analysis and GEX Insights-Jan. 3Technical Analysis (1-Hour Chart)
* Trend and Price Action:
* QQQ is trending downward on the 1-hour chart, respecting a descending trendline.
* The price has tested the $505.34 support level and is attempting a minor recovery. However, the overall structure remains bearish.
* Volume: Moderate volume during recent declines suggests continued selling pressure.
* Indicators:
* MACD: Signs of a potential bullish crossover, which could indicate a short-term recovery if confirmed.
* Stochastic RSI: Rising from oversold levels, signaling a possible bounce or consolidation.
* Key Levels:
* Support Levels:
* $505.34: Critical support level; breaking below this could lead to further declines.
* $500.00: Psychological support and significant GEX activity zone.
* Resistance Levels:
* $511.87: Immediate resistance aligning with the descending trendline.
* $515.00: Secondary resistance with CALL wall activity, marking a critical breakout level.
GEX Insights for QQQ
* Gamma Exposure (GEX):
* Positive GEX Zones:
* $515.00: Key CALL wall, acting as a significant resistance zone for upside movement.
* Above $520.00: Positive gamma increases, signaling a strong resistance cluster.
* Negative GEX Zones:
* $505.00: Highest negative gamma exposure and a critical support zone.
* Below $500.00: Gamma exposure becomes more negative, increasing downside volatility.
* Options Metrics:
* IVR (Implied Volatility Rank): 20.1%, indicating relatively low volatility pricing.
* Options Flow:
* Calls: Modest activity near resistance levels at $515-$520.
* Puts: Concentrated near $505 and $500, reflecting strong protective positioning by investors.
Trade Scenarios:
Bullish Scenario:
* Entry: Above $512.00 with confirmation of momentum.
* Target: $515.00 (initial), $520.00 (extended).
* Stop-Loss: Below $510.00 to limit downside risk.
Bearish Scenario:
* Entry: Below $505.00 with strong volume.
* Target: $500.00 (initial), $495.00 (extended).
* Stop-Loss: Above $510.00 to cap losses.
Conclusion
QQQ is at a pivotal level, with $505 acting as a critical support zone. A breakout above $515 could trigger bullish momentum, while a breakdown below $505 could lead to further downside pressure. GEX levels provide clear zones to monitor for potential trading opportunities.
Disclaimer: This analysis is for educational purposes only and does not constitute financial advice. Always conduct your own research and manage risk responsibly.

SPYQQQ Day Trade PlanHappy New Year!!
Watch for momentum(Volume). Watch for hesitation(Low volume). Simple Plan. Simple Execution. Happy trading.

QQQ: Annual outlookHey Friends,
Here is the annual outlook for QQQ!
Annual Levels:
Ref: 550.31 (Reference Target)
High 1: 575
High 2: 622.009
High 3: 668.81
Range Ceiling: 725
Low 1: 462.92
Low 2: 420.57
Low 3: 374.57
Range Floor: 322
ARIMA Forecast
Point Forecast at Day 252: 532.2314
80% Upper Confidence Level at Day 252: 707.6069
95% Upper Confidence Level at Day 252: 800.4451
80% Lower Confidence Level at Day 252: 356.8559
95% Lower Confidence Level at Day 252: 264.0177

Nasdaq (QQQ): Ready to Go Higher; Buy Signal Alert 💡 Setup Overview:
This bullish setup is perfect for those who love buying dips. The green box highlights an ideal entry zone supported by Fibonacci retracement levels.
🔍 Key Levels to Watch:
Entry Zone: $489.88 - $501.27
Stop-Loss: $488.67
Targets:
First Target: $526.47
Second Target: $551.80
📊 Strategy:
The focus remains on buying dips for indices like SPY and QQQ, avoiding shorting positions. This plan leverages Elliott Wave patterns and Fibonacci extensions for precise entry points.
🕒 Expected Timeline: Medium-term hold.

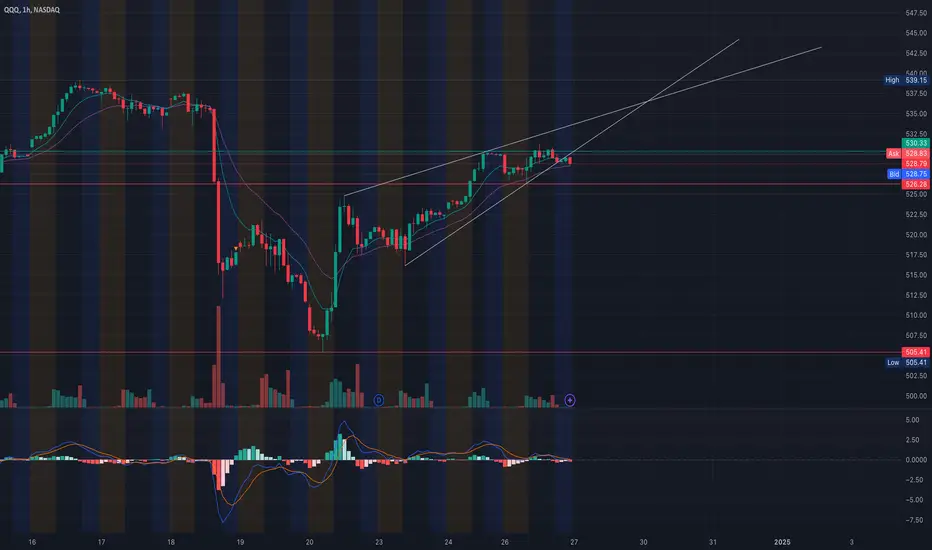
QQQ Technical Analysis (1-Hour Chart). Jan 2, 2025Price Action
* QQQ is trading in a descending channel, showing a clear downtrend over the short term.
* The price has tested the upper trendline resistance and failed to break above, confirming continued bearish pressure.
* The price is now near the middle of the channel, consolidating with slightly declining volume.
Indicators
* MACD: Bearish momentum persists as the histogram shows red bars and the MACD line remains below the signal line.
* Stochastic RSI: The indicator is nearing oversold territory, which may indicate a potential bounce or consolidation before continuing the trend.
Key Levels
* Resistance: $517 (upper channel resistance) and $514 (HVL resistance as per Options GEX).
* Support: $505 (lower channel boundary and put wall support from GEX data).
Trading Plan
1. For Longs:
* Wait for the price to break above $514 with strong volume and confirmation from MACD (crossover) and Stochastic RSI moving out of oversold.
* Entry: Above $514.
* Stop Loss: Below $505.
* Target: $522 (near next resistance level).
2. For Shorts:
* Enter if the price rejects at $514 or breaks below $505 with strong bearish momentum.
* Entry: Below $505.
* Stop Loss: Above $514.
* Target: $500 or lower channel boundary.
QQQ Options GEX Analysis (Daily Chart)
Gamma Exposure Levels
* Call Wall Resistance: $517 and $522, indicating strong resistance levels where call activity is concentrated.
* Put Wall Support: $505, marking a significant area of support from high put open interest.
* HVL at $514 is a critical pivot point that aligns with both GEX and price action resistance.
Volatility Insights
* IV Rank (IVR): 17.8, indicating relatively low implied volatility compared to historical levels. Options premiums may be cheaper for strategies like long calls or long puts.
Options Strategy
1. Bullish Strategy (If QQQ breaks above $514):
* Buy the $520 Call (weekly expiry) to capitalize on momentum toward $522–$525.
* Stop Loss: Close the position if QQQ falls below $514.
* Profit Target: Exit at $522 or $525.
2. Bearish Strategy (If QQQ breaks below $505):
* Buy the $500 Put (weekly expiry) to benefit from a drop toward $500 or lower.
* Stop Loss: Exit if QQQ reclaims $505.
* Profit Target: $500 or lower.
Disclaimer
This analysis is for educational purposes only and does not constitute financial advice. Always perform your own due diligence and manage risk appropriately when trading stocks or options.

QQQ Fib Levels - just touched 2.0I used to be a big advocate for Fib levels, but I feel like the lead me astray more times than helped, but none the less here is a high-level look with my estimate of fib levels. If I did it correctly, QQQ just touched off the 2.0 level. This could explain the weakness we saw this holiday season instead of the normal "Santa Claus Rally". Will we get a sizeable correction in 2025? Don't know, but there is clear weakness with some form of pullback coming. Just short term or something bigger, hard to know yet. I'm in the camp of a pump and dump on the Trump administration. How does it go, buy the rumor, sell the news. Feels like it to me.
Happy New Year!

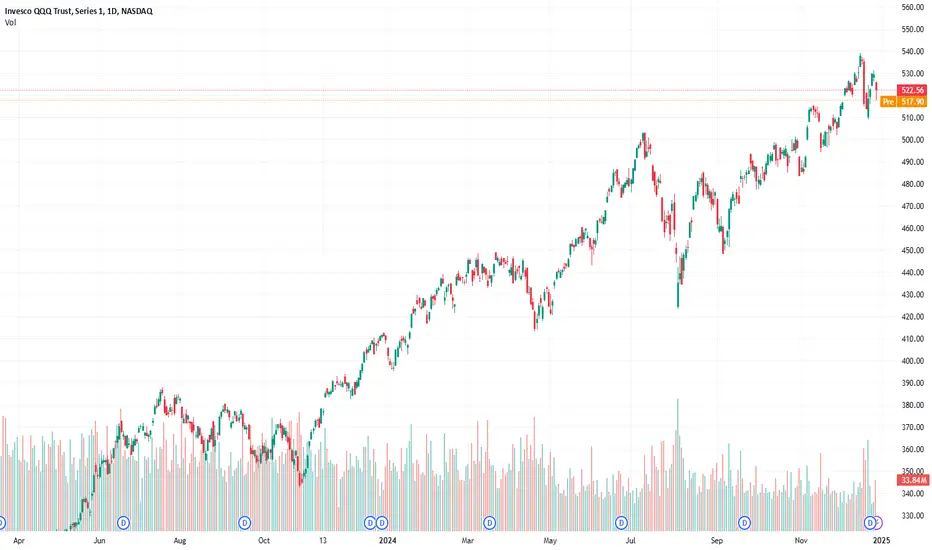
Invesco QQQ Trust (QQQ): Long-Term Elliott Wave Analysis📊 Chart Context: This analysis outlines the long-term Elliott Wave perspective for the Invesco QQQ Trust (QQQ), a tech-heavy ETF tracking the Nasdaq 100 Index. The current structure highlights a bullish trajectory with anticipated corrections before the next impulsive leg.
Elliott Wave Breakdown
Macro Structure:
- QQQ is in a right-side bullish structure, showing impulsive waves consistent with a long-term uptrend.
- Wave (III) was completed around 2021, followed by a multi-phase correction that formed Wave (IV).
Current Progression:
- Wave (V) reached a peak near $511.23, completing the first subwave of the larger bullish cycle.
- A corrective Wave II is anticipated, forming an ABC pattern, targeting deeper retracements.
Wave II Projection:
- Wave A may find initial support in the $460–$480 range.
- Wave B is expected to rebound before Wave C completes the correction near $420–$440.
Invalidation Level:
- The invalidation level for the bullish structure stands at $254.38. A break below this would negate the current wave count.
Key Levels to Watch
Support Zones:
- $480: First key support during Wave II correction.
- $420–$440: Deeper support for Wave C completion.
Resistance Zones:
- $560: Immediate resistance zone, marking the next potential peak for Wave III after correction.
For Long-Term Investors:
- Accumulation Zone: Between $420–$480 during the Wave II correction phase.
- QQQ presents a strong case for holding and adding positions as the broader bullish structure remains intact.
Fundamental Catalysts
Macro Environment:
- QQQ remains sensitive to Federal Reserve policies, especially interest rates, which heavily influence tech valuations.
- Economic growth in the tech sector will likely sustain the bullish narrative.
Tech Sector Growth:
- Continued advancements in AI, cloud computing, and other disruptive technologies will bolster the underlying Nasdaq 100 companies.
Conclusion
The QQQ chart aligns with a strong bullish Elliott Wave framework, with short-term corrections providing opportunities for strategic entries. The long-term trajectory suggests higher highs in the next wave cycle, targeting levels beyond $580.
💬 Drop your thoughts below! Are you holding QQQ for the long run, or trading the upcoming correction? 📈

QQQ Short-Medium Term PathsQQQ just broke below its uptrend from the August low, it did break once before but that lasted less than a day below. This looks bearish to me, expecting a move down to the previous ATH around $503 and then back to where the election gap was if that doesn't hold.
The most important level for longer term will be the trendline below from November 2023, seems bad if that breaks. If it can reclaim the trend from the August low instead it should set the stage for another new ATH soon after.

Long QQQ Next Week: Target Gains While Watching Key Levels- Key Insights: QQQ continues to show strength as it capitalizes on tech sector
momentum. Analysts predict that recent advancements in AI and cloud
technologies will sustain interest in major NASDAQ-listed companies. Given
favorable macroeconomic indicators, there’s strong potential for upward
movement in QQQ.
- Price Targets: Next week targets are T1=555, T2=570; Stop levels are S1=510,
S2=505.
- Recent Performance: Over the past week, QQQ has experienced modest gains,
propelled by positive earnings reports from key constituents. The index has
been resilient despite broader market fluctuations, demonstrating an
underlying bullish sentiment from buyers.
- Expert Analysis: Experts express optimism with a consensus that QQQ is well-
positioned for continued gains. The sentiment is bolstered by constructive
technical indicators and a solid economic backdrop. Many recommend strategic
entry points, especially after temporary pullbacks.
- News Impact: Recent news highlights developments in the tech sector, including
significant partnerships and innovations. An increase in consumer spending
on technology products has also positively influenced market perceptions
around QQQ's holdings, reinforcing bullish sentiment.
QQQ Testing Major Zones! Scalping, Swing, and Options OpportunitScalping Analysis for QQQ:
1. Support and Resistance Levels:
* Support at $520 (key gamma wall and recent horizontal level).
* Resistance near $523 (HVL) and $531 (call wall and gamma resistance).
2. Key Indicators:
* 9 EMA & 21 EMA: Price is below both EMAs on the hourly timeframe, signaling short-term bearish momentum.
* MACD: Bullish crossover forming, suggesting potential upward momentum if confirmed by price action.
3. Scalping Plan:
* Bearish Scenario:
* Entry: On rejection near $523-$525.
* Target: $520, $515.
* Stop Loss: Above $526.
* Bullish Scenario:
* Entry: Breakout above $523 with strong volume.
* Target: $526, $531.
* Stop Loss: Below $521.
Swing/Day Trading Analysis for QQQ:
1. Trendlines:
* QQQ recently broke below a short-term upward trendline but is attempting to retest support at $520. Watch for a breakout or breakdown to confirm direction.
2. GEX Analysis:
* Strong resistance at $531 and $535 (gamma resistance).
* Major put support at $520 and $515.
3. Trade Scenarios:
* Bullish Swing:
* Entry: On a breakout above $523 or bounce from $520 with confirmation.
* Target: $526, $531.
* Stop Loss: Below $519.
* Bearish Swing:
* Entry: Below $520 with a retest.
* Target: $515, $510.
* Stop Loss: Above $522.
Options Play with GEX Insights:
1. High GEX Areas:
* Call Wall: $531, $535.
* Put Wall: $520, $515.
2. Suggested Options Strategy:
* Bullish Play:
* Buy Jan 5th $525 Call if QQQ breaks and sustains above $523 with volume.
* Target: Move toward $526-$531.
* Risk: Below $521.
* Bearish Play:
* Buy Jan 5th $515 Put if QQQ breaks below $520.
* Target: $515-$510.
* Risk: Above $522.
3. Options Oscillator Metrics:
* Low IVR (15.5%) indicates relatively cheap premiums, favoring directional trades.
* Puts skew (36.9%) suggests stronger bearish sentiment near current levels.
Insights:
* QQQ is at a key inflection point between $520 and $523, with major resistance overhead at $531. A breakout or breakdown will signal the next major move.
* Volume Importance: Monitor for a surge in trading volume to validate directional moves, especially near $520 or $523.
Disclaimer: This analysis is for educational purposes only and does not constitute financial advice. Always trade responsibly and manage risk.


is QQQ just starting its new breakout?looks like Q's have brokeout and retested this huge fib ext. from the last bear market in 21-22. we now move onto 660

HOW-TO: Connect Indicators to the PSE, Practical Strategy EngineThis is a detailed video of how to connect your indicator(s) to the PSE, Practical Strategy Engine via the "Connection Indicator for the PSE".
Note:
The video shows the "PSE, Practical Strategy Engine" as "PSE".
The video shows the "Connection Indicator for the PSE" as "Connection Ind for PSE".
Copyright © 2024 CoinOperator LLC

Endless pump is gonna end at some pointTrump trade pump saved the market again which is overvalued as hell especially nasdaq
technically speaking you can see bearish divergence and bearish engulfing (W time frame)

Still Bearish on QQQThis just a follow on post for our Dec 20th post. Markets do not correct in a straight lines so just drew a probable market course. This follow on post is just an iteration to reduce the anxiety if you are short. Ignore the noises on the social media.
The area between 515 and 510 is a good support area which is already hit once. It would eventually breakdown and timeframe is still by Jan 21st.
All the best.
Marketpanda
Disclaimer: The information provided is for general informational and educational purposes only, and does not constitute financial, investment, or legal advice. None of the content shared should be relied upon as the sole basis for making investment decisions. Prior to making any financial or investment decisions, it is strongly recommended that you consult with a qualified financial advisor, accountant, or other professional who is familiar with your individual circumstances and risk tolerance. Any reliance you place on the information presented is strictly at your own risk, and we are not responsible for any losses, damages, or liabilities resulting from your investment or trading activities.

QQQ Long Signals and Targets for the week of Dec 23, 2024Analysis: QQQ Signals Detected
My analysis identified the following key long signals and targets for this week (Dec 24, 2024) and next:
Target 1: > 527.29, Status: Reached.
Target 2: > 531.74
Target 3: > 541.89
With the first target achieved, we are now monitoring progress towards the remaining targets.
Trading Plan:
Risk Management: Avoid excessive greed.
Profit Taking: Partially close positions upon reaching each subsequent target, unless there are further updates.
This strategy allows for securing profits while maintaining exposure for potential further upside.
Disclaimer:
This analysis is for informational purposes only and does not constitute financial advice. Trading involves inherent risks, and past performance is not indicative of future results.

Will QQQ hold support?QQQ testing the long term channel for support after breakout. Holiday are low volume and a usually a time for the market to climb some without any selling pressure. If I had to guess, then I would say we generally move sideway and up through the end of December. When the traders are back in full for in January will tell us if this rally continues or it has been a big pump and dump for the incoming Trump administration and its new policies.

We already bottomed, you just don't know it yet! NASDAQ:QQQ
We already bottomed, you just don't know it yet!
Daily Chart analysis:
A look back at 2024 shows us that every time we have come down to the Green support line on the Wr% we've bounced hard all the way back up to the red barrier.
It coincides with every time we've went below the 9ema that this occurs then we rocket back up. This time could be different but what I'm seeing on the weekly chart as well it doesn't look like it to me as we've already rebound back above the 9ema to this point.
I'm just a nerd who loves all things stock market, I'm no oracle but from my TA and my GUT we should bounce hard heading into the new year and back up to ATH's in January friends!
Not financial advice.

QQQ Poised for a Breakout! Scalping, Swing & Options Strategies Market Structure:
* QQQ has formed an ascending wedge pattern, suggesting potential breakout or breakdown scenarios.
* Price is consolidating around $529 after recovering from $505 lows, with the 9 EMA and 21 EMA trending upwards, signaling bullish momentum.
* A key resistance zone is evident at $531–$533, with strong support at $527.
Key Levels to Watch:
* Support Zones:
* $527: Immediate support aligned with the 2nd PUT wall from GEX and prior price pivot.
* $526: Major support near the 3rd PUT wall and ascending wedge base.
* Resistance Zones:
* $531: Immediate resistance; breaking above opens the door to $533 and $535.
* $535: Strong resistance and potential breakout target.
Indicator Insights:
* MACD: Flat but holding bullish territory; watch for crossover to confirm momentum.
* Volume: Lower during consolidation; expect volume spikes near key levels for directional confirmation.
* Options Oscillator: IVR (4.9) and net GEX suggest relatively low volatility but key resistance lies at $531 and $533.
Scalping Strategy:
1. Bullish Setup:
* Enter on a break above $531 with volume confirmation.
* Targets: $533 and $535.
* Stop Loss: Below $530 to limit risk.
2. Bearish Setup:
* Enter on a breakdown below $527 with bearish momentum.
* Targets: $526 and $524.
* Stop Loss: Above $528 for risk control.
3. Tools to Use:
* VWAP for intraday levels and RSI for momentum confirmation.
* React quickly to price movements at GEX-determined levels ($527, $531).
Swing Trading Strategy:
1. Bullish Scenario:
* Enter on a daily close above $531 with high volume.
* Targets: $533 and $535 for a short-term swing.
* Stop Loss: Below $529 to minimize downside risk.
2. Bearish Scenario:
* Enter if QQQ closes below $526 with bearish continuation.
* Targets: $524 and $520.
* Stop Loss: Above $528.
3. Indicators to Monitor:
* EMA (9/21) crossover and RSI levels for trend confirmation.
* Volume spikes at support or resistance levels.
Options Strategy Based on GEX:
1. Bullish Options Play:
* Buy a Call Option with a $530 strike expiring in 1-2 weeks.
* Target: Exit at $533 or $535 based on price action.
* Stop Loss: Close the trade if QQQ falls below $528.
2. Bearish Options Play:
* Buy a Put Option with a $527 strike expiring in 1-2 weeks.
* Target: Exit at $526 or $524.
* Stop Loss: Close the trade if QQQ rises above $529.
3. Neutral Strategy:
* Sell a Put Credit Spread at $527/$525, profiting from QQQ holding above $527.
* Maximum profit if QQQ remains above $527 by expiration.
4. Advanced Gamma Strategy:
* If QQQ holds above $531, consider selling a Call Spread at $533/$535 to collect premium while capping risk.
Actionable Plan for QQQ:
* Scalpers should focus on intraday moves between $527 and $531 with quick reactions to price action.
* Swing traders can capitalize on breakouts or breakdowns from $531 and $527, respectively.
* Options traders should leverage low IV and key GEX levels for directional plays or premium collection strategies.
Disclaimer:
This analysis is for educational purposes only and does not constitute financial advice. Always conduct your own research and trade responsibly.
QQQ Nasdaq 100 ETF 2025 Prediction - My Top 10 PicksIf you haven`t bought the recent dip on QQQ:
My price target for QQQ in 2025 is $608, driven by the following fundamental factors:
Strong Growth Potential in Technology:
The QQQ ETF is heavily weighted towards technology companies, which are at the forefront of innovation and growth. Major constituents like Apple, Microsoft, and NVIDIA are not only leaders in their respective fields but are also expected to benefit from ongoing trends such as artificial intelligence, cloud computing, and digital transformation. Analysts project that the earnings growth for QQQ constituents will outpace that of broader market indices, with estimated one-year earnings growth rates around 17.31%. This growth trajectory supports a bullish outlook as these companies continue to expand their market share and profitability.
Favorable Macroeconomic Conditions:
Recent Federal Reserve actions, including interest rate cuts, create a conducive environment for growth stocks. The Fed's dovish stance is likely to lower borrowing costs and stimulate investment in technology sectors. As interest rates decline, the present value of future earnings increases, making high-growth tech stocks more attractive. The anticipated economic recovery and stabilization should further enhance investor sentiment towards QQQ.
Historical Performance and Resilience:
Historically, QQQ has outperformed the S&P 500 in bull markets, showcasing its resilience during periods of economic expansion. Over the past decade, QQQ has delivered an average annual return of approximately 18.59%, significantly outpacing many other investment vehicles. This historical performance suggests that as market conditions improve, QQQ is well-positioned to capitalize on renewed investor interest in growth stocks.
