$QQQ Review of Black Monday
Alright - Yesterday - We stayed completely with in the implied move - you can see that both sides got tested which gave us some wild swings. Spreads on both ends paid. 10% intraday moves
We hit the bottom of the implied move, the top of the implied move and we saw resistance at the 35EMA.
QQQ trade ideas

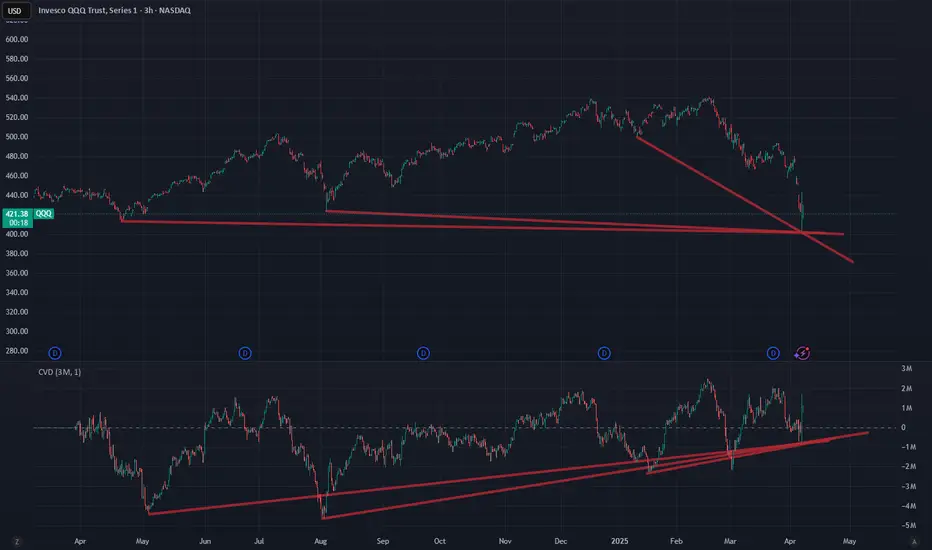
QQQ - The Time Is NowApril is wild. So take a deep breath and ... relax.
Because for traders with a longer-term investment horizon, now may be THE time to buy.
A look at the QQQ in the big picture shows that extremely strong bullish divergences have built up in the cumulative volume delta.
Yes, the crash was fast and violent. But, as we know: Fast is fake.
It can therefore be assumed that the QQQ will recover relatively soon.
Times may remain exciting for day traders, but investors on the hunt for bargains will be happy about perfect entry prices.
QQQ Major Trend BreakThe uptrend from the 2022 low has finally been broken and we also have a shorter term bear flag that has developed since the break as well. I'd consider this a very significant break that will likely lead to a move down to $405. We may see some relief there, but I expect that to break eventually as well which should lead to a full retracement back down to the 2022 lows.
It is starting...

$QQQ Recap of Last Week Historic DrawdownA historic week with unprecedented tariffs not seen since right before the great depression.
NASDAQ:QQQ We broke many supports and are looking for Support
Stay Tuned - Today's Trading Range is coming out.
Don't rush into a trader just to trade - But also, if you see a great opportunity take it.

SPY/QQQ Plan Your Trade For 4-7 : POP In Counter Trend ModeToday's POP pattern in Counter Trend mode suggests the markets will find support and attempt to POP upward a bit.
I expect the SPY to attempt to reach levels above 505 today. Possibly trying to peak near 510.
The same thing will happen with the QQQ - a potential rally (POP) higher targeting the 420-425 level.
Watch this video TWICE if you really want to understand what is taking place in the markets right now.
The tariff issue will settle over the next 15+ days. The SPY/QQQ are moving into the EPP Consolidation Phase (just like I've been telling you for months now).
BTCUSD is moving into a BREAKDOWN phase and will likely target $63k over the next 30+ days.
Gold and Silver reacted to the breakdown of the SPY/QQQ as they always do - PANIC SELLING.
Now that the panic selling pressure appears to be subsiding, Gold and Silver should build a base and begin an explosive move higher - targeting $4200-4500 for gold and targeting $41-44 for silver.
We live in exciting times and I still believe the US markets will DOUBLE or TRIPLE over the next 5-10+ years.
Get Some.

QQQ Crashes to Demand Zone! Market on Edge After Tariff Shock🔻 Market Context
The Nasdaq-100 ETF (QQQ) took a severe hit after Trump’s proposed tariffs rattled the broader market. Investors fled risk-on assets, dragging tech-heavy indexes into a sharp sell-off. This capitulation-type flush aligns with the "risk-off" tone the options market has hinted at for days.
Technical Analysis (1H + SMC)
QQQ broke structure decisively (BOS) and formed a bearish flag within a descending channel. Current price is hovering near the $420 support—this level acted as a major BOS zone, and we’re now testing it again from above.
The Smart Money Concepts (SMC) show multiple CHOCHs failing to reclaim higher liquidity zones around $475–$480, marking this area as a strong distribution zone. MACD and Stoch RSI are near oversold levels, showing momentum exhaustion, but no clear bullish divergence yet.
A small consolidation box is forming just above the demand zone. If this zone holds, a short-term relief bounce to retest $440–$448 could be in play. However, a breakdown below $419 would trigger further downside into the $405–$400 region.
GEX-Based Options Sentiment (1H)
* Highest Negative NET GEX / PUT Support is currently at $420, aligning perfectly with our price action floor.
* GEX10 at $434 and GEX9 at $440–443 form resistance blocks for any short-term bounce.
* The HVL at $475 (04/07 expiration) remains a major gamma magnet only if bulls reclaim $450+ levels.
From a flow standpoint:
* IVR: 101.8 – Options are relatively expensive.
* IVx Avg: 56.7% – Increasing volatility confirms fear.
* PUT$: 23.5% dominance – Bearish pressure is heavy.
* GEX is deep in the bearish zone, with multiple red markers suggesting downside continuation risk is still high.
Scenarios to Watch
Bullish Scenario
* Price holds $420 and forms a higher low.
* Breakout above $440 opens door to $457 → $475 zone.
* Risk-on confirmation if we reclaim $457 with strong volume.
Bearish Scenario
* Breakdown below $420 = major flush trigger.
* Price could cascade to $405–$400 near previous fair value gaps.
* Put support levels are likely to absorb some of the sell-off, but sentiment is fragile.
Final Thoughts
This is a high-volatility week. Institutions are hedging heavily. Don’t fight the trend—watch for clear reclaim above $440 to go long. Otherwise, trade level to level and protect your capital.
QQQ is not yet safe for investment—wait for reclaim above $457 and improving options sentiment before considering entries. For traders, short-term scalps off $420 with tight risk management are in play, but be prepared for violent swings.
This analysis is for educational purposes only and does not constitute financial advice. Always do your own research and trade responsibly.

QQQ Selling Just StartingIf you have any illusions this will be a buy-the-dip market, you are taking on a major risk!
1. Last time QQQ sold off it lost 84%
2. It took 17 years to break even
3. It took much longer to break even inflation-adjusted
You can't buy low if you don't sell first. You don't have infinite money.
WARNING!

$QQQ Has Officially Entered a Bear Market $SPX is CloseNASDAQ HAS OFFICIALLY ENTERED A BEAR MARKET, DOWN ~22%
NASDAQ:QQQ 2022 Bear Market bottomed ~37%
just below the 200WMA
S&P 500 is not quite there yet, down only ~17.5%
SP:SPX 2022 Bear Market bottomed ~27% a tick below the 200WMA

QQQ fibonacci retracementsThis is the QQQ and Fibonacci retracements from 2022 and 2020 to give you an idea of where support may lie. We crashed through support and sit in open air.
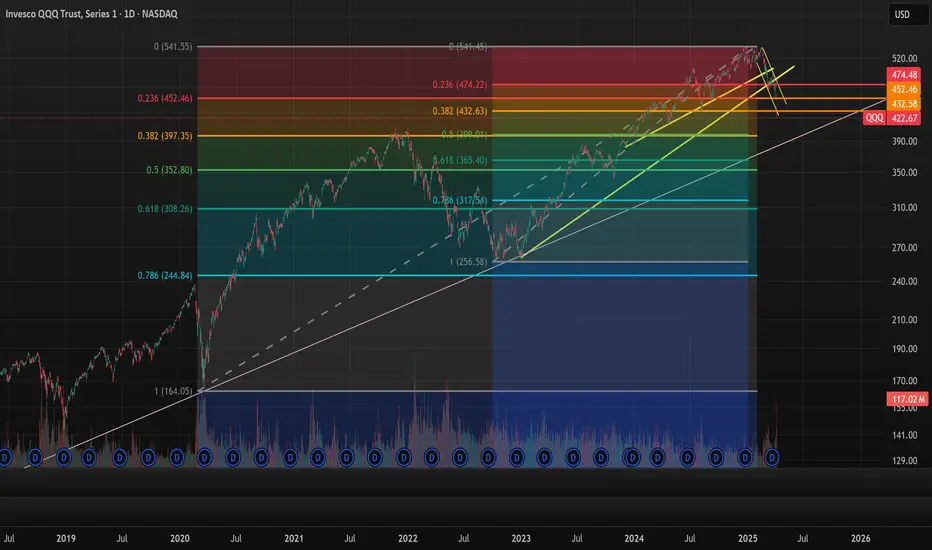
Nasdaq 100, QQQ expected to bounce from hereQQQ reached equal legs perfectly friday and is now expected to bounce monday to regain 50% of the decline from ATH. Then another leg to reach the long time trendline and volume support is expected.

How bad will it get? Let's talk about it!🌟 My Market Probabilities: 🌟
1⃣ 15% chance of a V-Shape recovery with a bottom at $410–$425
2⃣ 45% chance of a COVID-like Flash Crash resolving at
$385–$400
3⃣ 33% chance of a 2022-level bear market down to
$330–$350
4⃣ 5% chance of a 2008-level crash hitting $250–$260
5⃣ 2% chance of a crazy Dot.com-level crash dropping to $90–$110
💡 No matter which scenario unfolds, it’s a blessing in disguise! These dips create incredible opportunities to invest in great companies or indexes like the AMEX:SPY or NASDAQ:QQQ paving the way for massive, life-changing wealth over the years and decades to come.
🚀 Think long-term as an investor, friends, and stay focused on the bigger picture!

QQQ Stock Chart Fibonacci Analysis 040525Trading Idea
1) Find a FIBO slingshot
2) Check FIBO 61.80% level
3) Entry Point > 423/61.80%
Chart time frame: B
A) 15 min(1W-3M)
B) 1 hr(3M-6M)
C) 4 hr(6M-1year)
D) 1 day(1-3years)
Stock progress: C
A) Keep rising over 61.80% resistance
B) 61.80% resistance
C) 61.80% support
D) Hit the bottom
E) Hit the top
Stocks rise as they rise from support and fall from resistance. Our goal is to find a low support point and enter. It can be referred to as buying at the pullback point. The pullback point can be found with a Fibonacci extension of 61.80%. This is a step to find entry level. 1) Find a triangle (Fibonacci Speed Fan Line) that connects the high (resistance) and low (support) points of the stock in progress, where it is continuously expressed as a Slingshot, 2) and create a Fibonacci extension level for the first rising wave from the start point of slingshot pattern.
When the current price goes over 61.80% level , that can be a good entry point, especially if the SMA 100 and 200 curves are gathered together at 61.80%, it is a very good entry point.
As a great help, tradingview provides these Fibonacci speed fan lines and extension levels with ease. So if you use the Fibonacci fan line, the extension level, and the SMA 100/200 curve well, you can find an entry point for the stock market. At least you have to enter at this low point to avoid trading failure, and if you are skilled at entering this low point, with fibonacci6180 technique, your reading skill to chart will be greatly improved.
If you want to do day trading, please set the time frame to 5 minutes or 15 minutes, and you will see many of the low point of rising stocks.
If want to prefer long term range trading, you can set the time frame to 1 hr or 1 day.


Where's the bottom? Nobody knows but this could be relevant. No one knows where the bottom is, we can only speculate. Here are my very quick and very GENERAL thoughts based mostly on volume nodes.

QQQ: Tariff ReactionNASDAQ:QQQ As China strikes back with a 34% tariff on U.S. goods starting April 10, the global trade landscape could see some serious turbulence. This follows Trump's tariff moves, and the market's already feeling it: QQQ’s daily chart shows capitulation volume on the table, suggesting a potential bounce— IF tariffs ease.
But until these trade tensions subside, it's likely to be a rocky ride. Tariffs push prices up, inflation lingers, and the Fed finds itself boxed in. The outcome? A market crash, recession, and stagflation—yet, there's still hope for a bounce, depending on how these factors play out.
Manage the levels with us at ChartsCoach.

$QQQ: MORE DOWNSIDE AHEAD? (March 29, 2025)In this video, we analyze the NASDAQ:QQQ to determine whether we are at a bottom or if there is further down side ahead

ONLY BULLISH short term wave count QQQPanic is now clear the question is todays drop a wave C in a zig zag or is it wave 3 of 3 Not sure I am taking long positions at 420 area if we break 416 then wave stucture should drop to 398/+or - 3.1for wave 3 of 3 to end . The 1987 decline took 55 days that drop was a full 38.2 % drop oct 19th that date would be april 15

Using Fibonacci/Measured Moves To Understand Price TargetThis video is really an answer to a question from a subscriber.
Can the SPY/QQQ move downward to touch COVID levels (pre-COVID High or COVID Low).
The answer is YES, it could move down far enough to touch the pre-COVID highs or COVID lows, but that would represent a very big BREAKDOWN of Fibonacci/ElliotWave price structure.
In other words, a breakdown of that magnitude would mean the markets have moved into a decidedly BEARISH trend and have broken the opportunity to potentially move substantially higher in 2025-2026 and beyond (at least for a while).
Price structure if very important to understand.
Measured moves happen all the time. They are part of Fibonacci Price Theory, Elliot Wave, and many of my proprietary price patterns.
Think of Measured Moves like waves on a beach. There are bigger waves, middle waves, smaller waves, and minute waves. They are all waves. But their size, magnitude, strength vary.
That is kind of what we are trying to measure using Fibonacci and Measured Move structures.
Watch this video. Tell me if you can see how these Measured Moves work and how to apply Fibonacci structure to them.
This is really the BASICS of price structure.
Get Some.
#trading #research #investing #tradingalgos #tradingsignals #cycles #fibonacci #elliotwave #modelingsystems #stocks #bitcoin #btcusd #cryptos #spy #gold #nq #investing #trading #spytrading #spymarket #tradingmarket #stockmarket #silver

will they save itWeekly level looks in danger, will Mr market maker save it? Nothing surprises me anymore. Small play long for today.

Bounce & Continuation Watching for price action to bounce and test support before pulling back to test day key zone. Seems that overall market has yet to continue to the downside.

The Bear Market Has Arrived - Key Levels to Watch SPY QQQ IWMIWM is the first of the major averages to enter into a technical bear market after falling over 20% from its recent highs. QQQ will likely be next followed by SPY. I think there's good potential for a short term bounce around this area, but I believe there's a lot more trouble ahead in the medium to long term and it could accelerate quickly if we don't see any quick relief here.
Time to buckle up, I'm afraid the worst is yet to come.

QQQ and Tariff'sMeaningful momentum to the downside, looking for price action to enter into my zones.
Weekly support seems to be the trajectory.
I would wait and see for this week to end and market uncertainty to calm down slightly before making a swing play of any kind.

QQQ Slammed Below $465! Gamma Flip Confirmed QQQ Slammed Below $465! Gamma Flip Confirmed as Tariff Panic Grips Tech Sector
🌐 Macro Context (April 2, 2025)
Trump’s new tariff announcement this morning ignited fear of inflation returning and disrupted global trade expectations. That spooked big tech and growth-heavy indices like QQQ, triggering gamma-driven liquidation and a sharp intraday breakdown.
* Traders and dealers were not positioned for this headline — the rapid IV expansion and negative delta hedging caused a cascading sell-off.
* From a GEX perspective, today’s action triggered a flip below HVL ($471), with gamma accelerating downside volatility.
📉 Technical Breakdown – 1H Chart
Price Action:
* QQQ attempted to push through $475–$480, but got rejected violently.
* The huge red candle that nuked through $471 HVL and $469 confirmed a break of structure and bearish imbalance.
Support Zones:
* $455 – being tested now; psychological and options-related level
* $453.86 – today’s session low
* $450–$447 – likely short-term gamma target if weakness persists
Resistance Levels:
* $465 – 3rd PUT Wall
* $471 – HVL (now major resistance)
* $474–$477 – stacked CALL walls and former support
🔻 Options GEX & Dealer Positioning
GEX Flow:
* 🔴🔴🔵 = Short Gamma territory, and it’s growing more negative.
* Highest GEX support has disintegrated, with dealers hedging by shorting into the drop.
* Net GEX flipped negative below $471, increasing volatility.
* Dealer gamma continues to point down, with no major PUT walls until $450 zone.
Options Sentiment:
* IVR 38.4 / IVx avg 35.6 – slightly elevated vol, but with more room to rise
* PUTs 55.5% – bearish lean confirmed
* Expiry in 2 days + tariff panic = likely continuation or high chop volatility tomorrow
📌 Trade Setups
🐻 Bearish Continuation (Preferred Bias)
* Entry: Below $453.50
* Target: $450 → $447
* Stop: Above $458 reclaim
* Contract Idea: 0DTE or 2DTE $455P/$450P depending on risk appetite
* Note: Gamma trap zone from $455–$450 likely to accelerate price movement
🐂 Dead Cat Bounce Setup (Low Conviction)
* Only valid if QQQ reclaims $465+ with volume + positive options flow
* Target: $471–$474
* Play with small size or debit spreads due to risk of gamma reversal
🔍 Conclusion + My Thoughts
This tariff-triggered crash was unexpected, and it created a dealer short-gamma loop in QQQ. The break below $471 HVL turned the table fast. Unless QQQ quickly reclaims $465+, we're likely heading to test $450 levels in the coming sessions.
Tech tends to react aggressively to macro policy shifts, and the lack of near-term options support shows dealers are NOT stepping in. That opens the door for continued downside or extremely choppy relief rallies. Be fast. Be nimble.
🎯 Key Levels Recap:
🔴 HVL $471 Former support → resistance
🔻 Support $455 / $453.86 Price and psychological
🚨 GEX Target $450 / $447 Dealer hedging likely
🔼 Resistance $465–$471 Gamma ceiling now
📢 Final Tip: Watch VIX, bond yields, and /NQ overnight — any panic escalation may turn this into a larger gamma-driven flush.
Disclaimer: For educational purposes only. Not financial advice. Always manage your risk and position sizing accordingly.
