I'm a little nervous about this one - LONG QRVO at 83.02The chart is a mess. There's really no support close by after the big post earnings pop. 5 red candles in 6 days. Trump tariffs taking effect this weekend...nobody in their right mind should take this trade. So why did I?
A) I literally have only JNPR in my portfolio when it comes to tech, so I am underrepresented in the space.
B) anyone who follows me already knows what I'm about to say... my algo made me do it. 295-2 with an average gain of 1.93% in an average of 13 trading days (.15%/day - about 3.5x the average return of the market). It has had some rough trades in the last year (long holds and more lots of capital committed than I'd like), but this is a probability game for me, so I'm hoping it'll go as smoothly as my other trades have lately. I'm prepared for that not to be the case, though. I don't like what the market did today and I think it could be a bumpy ride next week. I may regret not just leaving this money in AMEX:BIL over the weekend, but that's the trading life. Wish me luck.
Per my usual strategy, I'll add to my position at the close on any day it still rates as a “buy” and I will use FPC (first profitable close) to exit any lot on the day it closes at any profit.
As always - this is intended as "edutainment" and my perspective on what I am or would be doing, not a recommendation for you to buy or sell. Act accordingly and invest at your own risk. DYOR and only make investments that make good financial sense for you in your current situation.
QRVO trade ideas

QRVO Bullish Setup – 1:23 R:R at Strong Support with High VolumeNASDAQ:QRVO has seen a huge downfall, but it’s now sitting at a key support level, making this a critical area to watch. Massive volume in the last few months suggests strong interest, potentially signaling accumulation.
If there’s a place to buy this stock, this is one of the best risk-to-reward spots, offering a 1:23 R:R setup if support holds. Watching for signs of a reversal! 📈

Qorvo Tunes Into a Bullish Surge Toward $98.91Qorvo Inc. is exhibiting strong bullish momentum, with a gap forming around the $72.00 level. A breakout above the $86.84 resistance would confirm further strength, positioning the stock to target the $98.91 resistance. This trade setup offers an excellent risk-to-reward ratio, with a stop-loss set at $67.56 to manage downside risk.
Analyst consensus reflects optimism for QRVO, with an average price target of $91.82, indicating a potential upside of approximately 28.96% from current levels. The highest price target is $128.00, while the lowest is $69.00. This positive outlook is underpinned by Qorvo's leadership in radio frequency (RF) solutions and its strategic positioning in high-growth markets such as 5G, the Internet of Things (IoT), and automotive applications.
The recent acquisition of a 7.7% stake in Qorvo by activist investor Starboard Value, worth approximately half a billion dollars, signals confidence in the company's potential and may lead to strategic initiatives aimed at enhancing shareholder value.
This combination of technical momentum, favorable analyst projections, and strategic investments supports a bullish push toward $98.91, making QRVO an attractive opportunity for traders and investors alike.
NASDAQ:QRVO

CROSSOVER MA Squeeze incoming with BB narrowingThe Bollinger is curving, and a squeeze indicator has not been triggered yet, but with an MA crossover and other bullish territories, this could see a major incoming shift on the bull's side.

Qorvo (QRVO) AnalysisMarket Position and Growth Drivers:
Qorvo NASDAQ:QRVO is experiencing robust growth, driven by significant gains with key mobile customers and strong performance in the defense and aerospace sectors. The company supplies RF chips to major Android OEMs like Samsung, showing expansion in the South Korean market. In China, top OEMs are adopting more of Qorvo's chips, with volume shipments expected this year.
Financial Outlook:
Qorvo anticipates fiscal 2025 Q1 revenue of $850 million, a 30% increase from last year. Analysts forecast a 3% increase in full-year revenue to $3.9 billion and an 8.3% increase in fiscal 2026. With Apple and Samsung as major customers, Qorvo is well-positioned for growth in AI-driven smartphone technologies.
Investment Outlook:
Bullish Outlook: We are bullish on QRVO above the $114.00-$115.00 range.
Upside Potential: With an upside target set at $160.00-$165.00, investors should consider Qorvo's strong customer base and growing market presence as key drivers for future stock appreciation.
📊🔬 Monitor Qorvo for promising investment opportunities! #QRVO #TechStocks 📈🔍

QRVO, may do a NVDA surge type move in the coming months!...QRVO is registering massive net buy volume, as numbers has surged 3-folds from 1.22M to 3.46M -- conveying that the recent earnings call is attracting position takers in anticipation of the company's turnaround in terms earnings and growth. Monthly data is showing some shifting trend. Pricewise, the stock formed higher lows cementing its intention to reverse to the upside.
The stock is currently sitting below 78.6 LEVEL, this is already a bargain / discount level. Best to seed on this area.
A bubble up volume (bottom indicator) has reappeared after 4 months of waiting -- bounce is in line with the solid support levels at 100'ish range.
Expect some significant bounce from the current range. A $200 price retest valuation in the future is not too far-fetched.
Another key note: MONTHLY DESCENDING TRENDLINE has been broken. Huge hint.
Spotted at 100.0
Safeguard capital always.
----------
FUNDAMENTAL / FINANCIAL NEWS REF: Source - MarketWatch.
Share of Qorvo Inc. QRVO, +0.11% rallied after hours on Wednesday after the wireless-technology provider’s first-quarter sales forecast and fourth-quarter results topped expectations, following efforts to lean down its stockpiles of components for Android smartphones amid “weakness in end markets.” The company — which makes cellular technology and Wi-Fi for smartphones and other digital devices, along with radio-frequency and power-management products for a variety of industries — said it expected first-quarter sales of $620 million to $660 million, with adjusted earnings per share of 15 cents, compared with FactSet estimates for $626 million and earnings per share of 18 cents. “We anticipate continued progress reducing Android channel inventory in the coming quarters, with a return to historical norms by calendar year-end,” Chief Financial Officer Grant Brown said in a statement. Shares raced 8.7% higher after hours. For its fiscal fourth quarter, Qorvo reported a net loss of $138.4 million, or $1.39 a share, contrasting with a profit of $212.3 million, or $1.95 a share, in the same quarter last year. Revenue fell to $632.7 million, compared with $1.17 billion in the prior-year quarter. The company reported adjusted earnings per share of 26 cents. Analysts polled by FactSet forecast adjusted earnings per share of 12 cents on sales of $621 million.

QORVO SETUP FOR BULLISHBismillahirrahmanirrahiim
1. Intact Uptrend
2.Retest Support and Lower BB
3. Bullish Divergence on W1
4. Candlestick Compression Signal
5. Significant Volume
Inshaa ALLAH

QORVO Stock Chart Fibonacci Analysis 042823Trading Idea
1) Find a FIBO slingshot
2) Check FIBO 61.80% level
3) Entry Point > 88/61.80%

$QRVO longLook at this bullish chart. Should be self-explanatory. If you've got any questions feel free to use the comment section down here ...
Good trades, folks!

bullish Waiting for a confirmation regarding the inverse H&S pattern which will end the downtrend. $140 is very possible from this point. Qorvo chart is one of the so predictable charts in this period, too bad that the liquidity for this stock is not so great.

WATCH $QRVOBearish/Bullish
Fundamental
- High inflationary Macro environment / no fear sentiment
- Funds not accumulation
- Positive PE
- Positive PEG
- Positive P/FCF
- Bad Sector / Industry / Leader
- Long term uptrend with good R/R however demand in Semi-con might be lacking / over supply
Technical
- Momentum Theory Indicator - waiting to bottomed
- Price action formation ( falling channel )
- Yet to break Trend line
- Price 200MA
- Price above POC
- ST not ok
- No Bullish Candlestick pattern / formation
Entry idea
- For members
Stop loss depending on entry and risk appetite. But always set meaningful stops.
"Discipline is rarely enjoyable but almost always profitable."
Cheers and happy trading!

$QRVO with a Bearish outlook following its earnings #Stocks The PEAD projected a Bearish outlook for $QRVO after a Negative Under reaction following its earnings release placing the stock in drift D with an expected accuracy of 100%.

25/5/2022 NASDAQ (QRVO)Short (Entry Price) below the black line and exit (Stop Loss) above the red line. Can take profit at the suggested Target Price.
Entry Price: $101.70
Target Price: $99.85
Stop Loss: $104.79

RectangleQRVO appears to be bouncing around in a rectangle which is a neutral pattern until a trendline is broken with a trend in that direction.
This could be a bottom for now as a rectangle is a consolidation pattern , so the support at the bottom of the recctqangle is strong as it has been reinforced a few times. This does not mean it can not break to the downside.
To calculate targets for a rectangle, take the width of the rectangle and project it up from the top trendline/resistance/then project it down from the bottom trendline for down targets. These are only guesstimates. But i will give you an idea.
There was an ugly top for QRVO and I possibly see a Rectangle top that has long since broken to the downside.
I do not go short, so I look at things from a long perspective. I like to do a chart to see how low price may go. Keeping in mind it can always go lower.
There are signs of thin trading on the 1 minute time frame. The candles are flat without much of a body.
Short percent is 2.72%.
No recommendation

IRON TARIHi guys,
acording to the strategy here we found ann iron condor, 4 weeks 10% strike, 86% to get the maximum premium.
The maths are easy, for more details check my script and subscribe to identify more opporunities like these.
Enjoy your wallet!
Tari.

QRVO EMA Crossover/ Head n ShouldersQRVO is showing a longer term head and shoulders pattern where it looks like it may meet the neckline around the 181 area. The EMA crossover to the downside is a hint to further dowside towards the neckline.

Cup and HandleEstimated earnings are 8-4 AMC.
Mid cup is very close to the HL so there is alot of support there
No recommendation

GRWG & QRVO - Full Long Targets ReachedGRWG - Full target of $51.00 reached.
QRVO - target of $196.00 exceeded.

Qorvo Inc: In Target Range, Take 70% Profit For +5.3% Qorvo Inc: In Target Range (194.00-196.00). Take 70% Profit For +5.3%
Intraday high of $195.10
Could continue to move higher, so retain 30% and sell those higher.
Qorvo Qorvo is an American semiconductor company that designs, manufactures, and supplies radio-frequency systems for applications that drive wireless and broadband communications, as well as foundry services.
Mkt Cap: $20bn
Regaining pivot and attempting to clear short term horizontal to downward trend line.
Buy Range: Current $185.13 down to 184.30
Stop: $181.70
Target Range: $194.00-196.00
For those looking at the options, the 16-July 190 calls are trading at $3.00 (Bid:2.80/Ask: 3.10)
QRVO210716C00190000

$QRVO can fall in the next daysContextual immersion trading strategy idea.
Qorvo, Inc. develops and commercializes technologies and products for wireless and wired connectivity worldwide.
The demand for shares of the company looks lower than the supply.
This and other conditions can cause a fall in the share price in the next days.
So I opened a short position from $171.47;
stop-loss — $180.39.
Information about take-profits will be later.
Do not view this idea as a recommendation for trading or investing. It is published only to introduce my own vision.
Always do your own analysis before making deals. When you use any materials, do not rely on blind trust.
You should remember that isolated deals do not give systematic profit, so trade/invest using a developed strategy.
If you like my content, you can subscribe to the news and receive my fresh ideas.
Thanks for being with me!

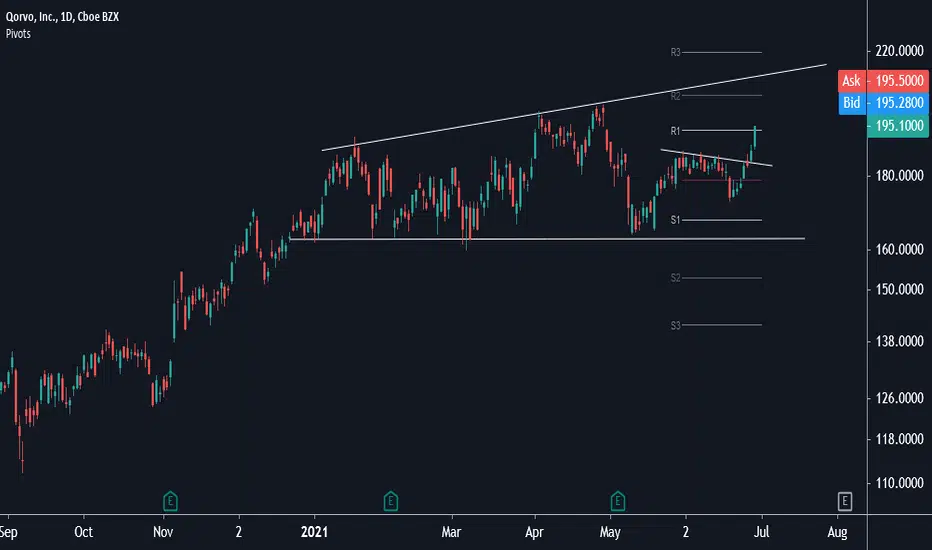
Qorvo stock of the week $QRVO.
Broke out of 3-month consolidation level at the $185 Fibonacci level.
Semis are hot and will continue to rise beyond ATH.
Price target is $220, which is at the -1.618 Fibo level.
50-Day EMA reclaimed 3/26 Friday and BUY signal on the Ultimate Stock Indicator flashed this past Friday, 4/2.
To find out more about The Ultimate Stock Indicator on Tradingview, please check my public profile. 🚀🚀🚀🚀

RectangleQRVO was burning down the house today! Something got in it's way. Appears to be trading in a rectangle top, or a horizontal trading channel. This pattern is neutral until the upper or lower trendline is broken with a trend in that direction. Like a symmetrical triangle, it is a consolidation pattern. Often it is also a continuation pattern, but not always.
Some folks swing trade from the top to the bottom, or from the bottom to the top. Can be a dangerous bet though but I guess most trades can be dangerous. You could place your stop right under the trendline or over the trendline depending on which way. Not a suggestion (o: Getting in to a trade close to strong support is usually the safest bet but even that can fail. Support and resistance levels were made to be broken or price would range all of the time.
You can get a ball park estimate on where price may end up by taking the width of the structure and extending it upward and downward from the trendlines . You can find mid rectangle by finding what you feel to be the top and bottom trendlines. subtract the bottom from the top, and divide it by two. This makes a good stop whatever direction price may go.
At least 5 touches are needed, 3 to one trendline and 2 to the other, to have a true rectangle. Often you can see one forming after 4 touches. Sometimes the 5th touch is the charm for both symmetrical triangles and rectangles, but by no means always. This one has already had 6 touches and there has been no breakout as of yet.
There is a gap below price.
Theremay be another pattern forming as well. I am not going there at this point. Sometimes a harmonic pattern can appear to be a double top, and they are often a double top, but there is also a pattern in formation. What you get is a crooked M looking structure with a bullish harmonic pattern. I am not saying this will break to the downside. This pattern is neutral until a trendline is broken.
A well loved stock and I feel it is a strong stock. I will watch it for now.
No recommendation.
Winning a bad bet can be dangerous (o:
