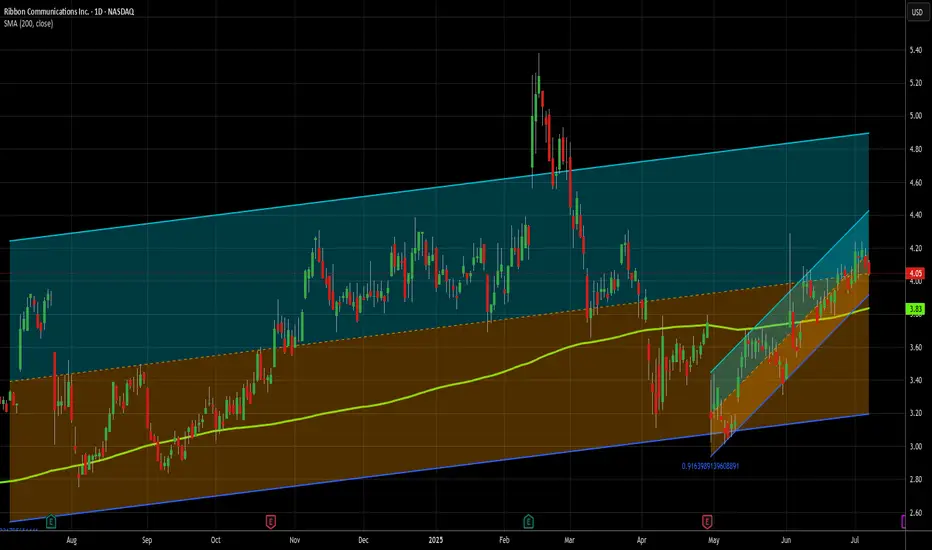
Small cap is the flavor of the day - Long at 4.05I decided to do a small cap stock today. I don't use too many of these as ideas, though I do trade them on my own. I don't usually publish about them because they are inherently more risky than large cap, established stocks. And to be fair, RBBN has a spotty history from a chart perspective.
Go ahead and zoom on out all the way. See that? That's what danger looks like. This stock has lost 80% of its value in the last 10 years, and 50% in the last 4. However, in its defense, it is profitable on a reported earnings basis over the last 12 months, and has held its own for several years now, and that's why I'm not AS nervous as I might otherwise be publishing this.
Additionally, it's solidly above its 200MA and in both a 1 year and 2 month uptrend, so its recent strength is good. I haven't dug down all the way back to its debut, but I suspect I'd have at the very least had a challenge making money on this one over its entire existence. But I am not trading its entire existence today. 75% of the trades in this stock in the last year would have closed in under 2 weeks, so the short term picture is what I'm mostly looking at here, and over the last month or so this has been a very solid stock. Could that change tomorrow? Yup. But I don't have that crystal ball. All I can do is rely on the system that has of late produced excellent results here.
In the last 12 months, there have been 27 buy signals here. 25 closed profitably and 2 are still open and down 18% and 9%, respectively. INCLUDING the losers, however, the median daily return on those trades has been .48% (>10x the market avg) and the average daily return is 1.02% (> 23x the avg daily market return).
Trading is about balancing risks and rewards. This stock is riskier than most, but the rewards are a lot better, too. I don't put all my money into any one trade - that's a TERRIBLE idea. The vast majority of my open trades are relatively safe, large cap stocks. But risky has its place in a portfolio. I made 15% in 2 days recently on QUBT (I posted that trade here) and made almost 18% on NUTX in the last 2 days - just closed that trade today. As a % of my portfolio of trades, ones like that can be small positions, but make a meaningful impact. That's my hope for RBBN here.
Of the 25 winning trades in the last year, over half produced a gain of 4% or more. And the average holding periods of the winners was only 8 days, with 15 of the 25 closing in a week or less. That rapid return also reduces the risk in a stock like this one. Wnen you only stick around for a few days most of the time, it's harder (not impossible) to get caught holding the bag during a drop.
My close will be signal based, and not a particular price target, but the trades I referred to above on RBBN give a good outline. However, the 2 losers have been open since February, so be forewarned that IF you follow me on this one, you might need to buckle your chinstrap. It could get bumpy.
As always - this is intended as "edutainment" and my perspective on what I am or would be doing and why, not a recommendation for you to buy or sell. Act accordingly and invest at your own risk. DYOR and only make investments that make good financial sense for you in your current situation.
RBBN trade ideas
Long Trade Setup Breakdown for(RBBN)-30-Mins📊 Long Trade Setup Breakdown for Ribbon Communications Inc. (RBBN) - 30-Min Chart
🔹 Asset: Ribbon Communications Inc. (RBBN)
🔹 Timeframe: 30-Min Chart
🔹 Setup Type: Symmetrical Triangle Breakout
🚀 Trade Plan (Long Position):
✅ Entry Zone: $5.00 (Breakout Confirmation)
✅ Stop-Loss (SL): $4.82 (Below Support)
🎯 Take Profit Targets (Long Trade):
📌 TP1: $5.24 (First Resistance)
📌 TP2: $5.49 (Extended Bullish Target)
📊 Risk-Reward Ratio Calculation:
📈 Risk (Stop-Loss Distance):
$5.00 - $4.82 = $0.18
📈 Reward to TP1:
$5.24 - $5.00 = $0.24
💰 Risk-Reward Ratio to TP1: 1:1.3
📈 Reward to TP2:
$5.49 - $5.00 = $0.49
💰 Risk-Reward Ratio to TP2: 1:2.7
🔍 Technical Analysis & Strategy:
📌 Breakout Confirmation: Strong buying momentum above $5.00 signals continuation.
📌 Pattern Formation: Symmetrical triangle breakout, indicating a bullish move.
📊 Key Support & Resistance Levels:
🟢 $4.82 (Strong Support / SL Level)
🟡 $5.00 (Breakout Zone / Entry)
🔴 $5.24 (First Profit Target / Resistance)
🟢 $5.49 (Final Target for Momentum Extension)
🚀 Momentum Shift Expected:
If price stays above $5.00, it could push towards $5.24 and $5.49.
A higher volume breakout would confirm strength in the trend.
🔥 Trade Execution & Risk Management:
📊 Volume Confirmation: Ensure buying volume remains strong after breakout.
📈 Trailing Stop Strategy: If price reaches TP1 ($5.24), move SL to entry ($5.00) to lock in profits.
💰 Partial Profit Booking Strategy:
✔ Take 50% profits at $5.24, let the rest run to $5.49.
✔ Adjust Stop-Loss to Break-even ($5.00) after TP1 is hit.
⚠️ Fake Breakout Risk:
If price drops below $5.00, be cautious and watch for a retest before re-entering.
🚀 Final Thoughts:
✔ Bullish Setup – If price holds above $5.00, higher targets are expected.
✔ Momentum Shift Possible – Watch for volume confirmation.
✔ Favorable Risk-Reward Ratio – 1:1.3 to TP1, 1:2.7 to TP2.
💡 Stick to the plan, manage risk, and trade smart! 🚀🏆
🔗 #StockTrading #RBBN #BreakoutTrade #TechnicalAnalysis #MarketTrends #ProfittoPath

RBBN - Aug 11RBBN - Aug 11
it just blacks out the downtrend
My targets:
TP1= 8.20
TP2= 9.18
TP3= 12.13
And my Stop loss = 6.60
its just my thought, good luck with it

RBBN - upCybersecurity stock, this is a strong sector at the moment.
Made a gap up on earnings, back to the strong level
double bottom
good fundamentals

RBBN BullishMACD crossing and the price closed over the .23 fibonacci level.
Current price is bellow the poc and it broke out of the weekly descending trend line.
first target : 8.94
second target: 9.39


APPROACHING SUPPORT AND POTENTIAL BOUNCEMonitor price action on how it approach to the demand zone. Please note that sellers are still exist in the market which they push the price to the downside with strong bearish momentum. I would consider my entry in the green zone area as it is in line with support trendline.

RBBN possible breakout to upsidePretty extended at these levels but has a chance to break out.
Demand zones area lined up well for dip buys as well

$RBBN #Cup&Handle SetupDaily cup and handle setup on Ribbon Communications. Handle forming on low volume (bullish sign).
Ribbon Communications (RBBN)- DESIGNS CARRIER-CLASS TELECOM INFRASTRUCTURE EQUIPMENT AND SOFTWARE USED BY WIRELESS AND WIRELINE OPERATORS

$RBBNEntry price : 6.79
Fundamentals :
Sector: Telecom
EPS % Chg (Last Qtr): 23%
3 Year EPS Growth Rate: 9%
EPS Est % Chg (Current Yr): -36%
Sales % Chg (Last Qtr): 68%
3-Year Sales Growth Rate: 31%
Annual Pre -Tax Margin: 12.3%


RBBN 50-day MA moved above its 200-day MA on June 23, 2020This price move may be construed as a buy signal, as it indicates the trend is shifting higher.
A buy signal is indicated by this change in price, due to the trend repositioning higher. In 3 of 3 cases where RBBN's 50-day Moving Average crossed above its 200-day Moving Average, its price rose further within the subsequent month. The odds of a continued Uptrend are 90%.
