RCEL - Long-term falling wedge - Long setupWe've got smart money divergence on the smart money divergence scan on the 27th of June. If you look at the weekly chart, you'll see that there is a falling wedge pattern. And longer-term support that dates back eight years, and yes, that is still relevant. This is a speculative setup. Acorn likes this setup because of the long-term support. It has got some longer-term momentum potential. In the short term
RCEL trade ideas
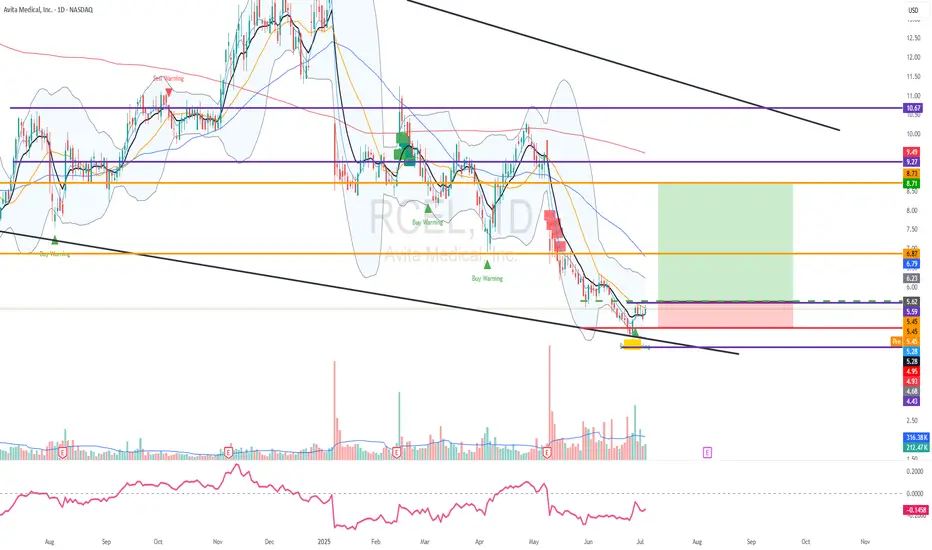
will the 2 green support lines reverse the sp move to bullish ?the black support line couldnt hold the sp from falling, now the question is will the 2 green support lines reverse the sp move and prevent the further fall ?

back support line seems valid and might holdjust bought few today purely technical reason as the back support line seems valid and might hold the SP

$RCEL fda approval and market likes it.Abnormally large volume. Close above $16.90, and while not exactly fitting a buyable gap up its looking more like it.

$AVH 1month base. gap filled and bounced. $4.13 break on vol?Seems to be a top little market leader. See if the market agrees for a continuation move out of a 1M base.

$AVH $1.87 Range tradeAVH looks to be moving out soonish, given were already above yesterdays volume, might provide sooner than later
Target in red
Holding from 1.835

AVH - Could provide a Buying Opportunity!AVH has bounced off strongly off support and the break lower could be a false break of Support. My Buy Zone is between $4.75 and $5.00 where I may be buying the pullback once price action confirms it, with a potential target of the previous highs. Price is currently showing resistance at the 200SMA and could pullback lower to provide a new buying opportunity.
Please note these are my own notes, by no means trading advice. Please do your own research before entering into any trade.

AVH a few signs of lifelooks like the early start of some signs of improvement, worth a look when it rises about 5.50-5.60


AVH - Avita - LONGFalling Wedge pattern seems to have finished with a nice breakout of the pattern. Heavy resistance at the 200ma mark. It should come back to test support and hopefully will hold. You could wait for 50 to cross 200 for full confirmation or wait to see if Support holds. Either way this is looking good for a long setup.

Do not ignorePrice jumped up today 15% on a QTR update. Weekly shows the price in a wedge testing the 78.6% fib retracement & bouncing of that zone. Daily - Price is testing $5.55 - $5.60 a historical support/resistance zone. Break of that zone & the trendline will be bullish

RCEL, Broadening Bottom (bearish) I found this pattern at tickeron website with the following data:
STATUS = Confirmed
CURRENT CONFIDENCE = 82%
TARGET (EXIT) PRICE = 12.07 USD
BREAKOUT (ENTRY) PRICE = 20.50 USD
DISTANCE TO TARGET PRICE = 41.23%
EMERGED ON = Oct 30, 12:00 PM (EDT)
CONFIRMED ON = Oct 30, 03:39 PM (EDT)
WITH CONFIDENCE LEVEL = 95%
The Broadening Bottom pattern forms when a security price makes higher highs (2, 4) and lower lows (1, 3, 5) following two widening trend lines. The price is expected to move up or down past the pattern depending on which line is broken first. What distinguishes a Broadening Bottom from a Broadening Top is that the price of the security is declining prior to entering the pattern formation.
This type of formation happens when volatility is high or increasing, and when a security's price is moving with high volatility but or no direction. It potentially indicates growing investor nervousness and a little indecisiveness.
Trade idea
If the price breaks out from the bottom pattern boundary, day traders and swing traders should trade with a DOWN trend. Consider selling the security short or buying a put option at the downward breakout price level. To identify an exit, compute the Target Price by subtracting the pattern height from the breakout point. Pattern height is a difference between patterns highest high and its lowest low.
To limit potential loss when price suddenly goes in the wrong direction, consider placing a stop order to buy back a short position or sell a put option at or above the breakout price.

AVH with a Bullish Price Objective.As the SMART MONEY trapped the short seller 3 times since July, in order to accumulate for medium/long terms, their motives gave us couple of bullish targets to watch going forward.Since both Vertical and Horizontal counts are identical, I am only publishing the vertical count as shown on the chart for educational purposes only.
Analysis continues....

AVH Long entry triggered.23 of August I have published the Monthly chart.
Today what I was anticipating has happened.That is long entry intra month WYCKOFF WAY!
THIS ANALYSIS IS NOT AN INVESTMENT/TRADING ADVICE.

Is AVH Low Risk LONG ENTRY on the horizon ?Still a secondary correction within a major uptrend in major time frame monthly with LOW RISK LONG ENTRY pending.
End of Month close above Climax Low of $6.50 is what I am looking for.A perfect Turtle Soup entry that would be !
This TA analysis is not to be taken as a financial advise.


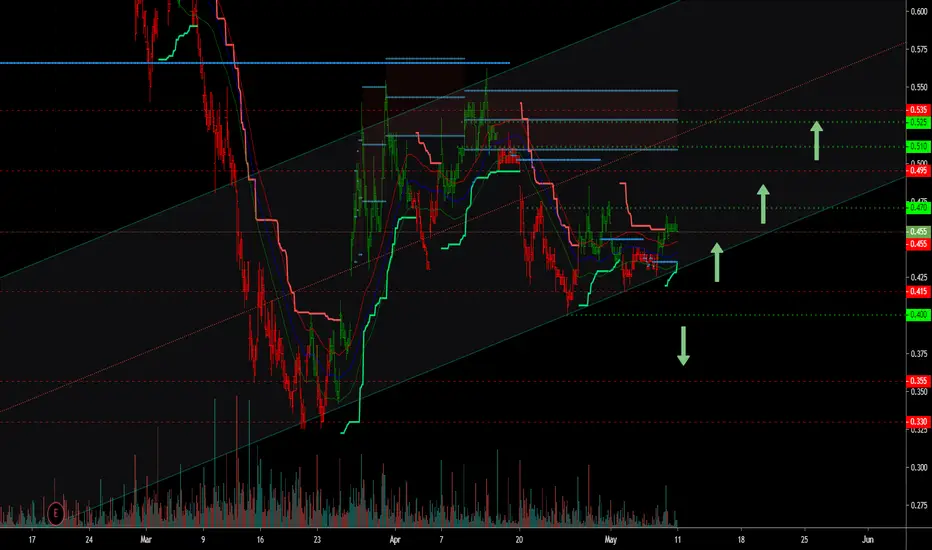
AVH - Technical analysis plus some essential fundamental values.Technical:
Pulled back to a critical retracement level at 0.415 and managed to bounce off, which now has formed a strong support base and also formed an uptrend price channel.
Weekly Performance 4.55%
Monthly Performance -4.17
3-Month Performance -36.99
Fundamental:
- Market Capitalization - 981,378,000
- Total Shares Outstanding (MRQ) - 2,133,430,000
- Total Debt (MRQ) - 3,841,263.00
- Total Current Assets (MRQ) - 130,243,588.00
- Total Revenue (FY) - 7,705,398.00
A future star ?IMHO This stock has a great future. The chart is of a 4 hour timeframe & a picture speaks a thousand words. Be cautious buying any stock at current levels till we can identify a trend.

An invertered cup Hi guys, I am seeing a lot of inverted cup patterns across the board. I took the internal cup measurement and placed the same price guide on the handle where it broke the handle resistance. This seems to correspond to the fib levels. This could still drop a bit a this virus is just starting to take off. DYOR

ABC Correction to follow...I have counted 5 big waves up here on the log and switched it to lin for you guys to get a better visual...we should be expecting to see a big correction here, I have drawn an ABC to play out but it can be different the MAIN takeaway here is that we have completed 5 waves up and we're most likely going into a big ABC correction.

