Waiting for a pullbackI have sold an get some gains but still thinking that NASDAQ:RGTI will fly sooner
At this moment, just watching and waiting for a pullback to enter again at $12 level
RGTI trade ideas

RGTI - Retesting the neckline?Cup and handle formation on the daily timeframe. Looks like the trend is currently retesting the neckline (horizontal line shown in orange).

Rigetti: Quantum Mirage or Computing's Next Frontier?Rigetti Computing, a pioneer in quantum computing, recently commanded market attention with a significant 41% surge in its stock. This jump followed a critical technological breakthrough: achieving 99.5% median 2-qubit gate fidelity on its modular 36-qubit system. This represents a twofold reduction in error rates from previous benchmarks, a vital step toward practical quantum applications. Rigetti's superconducting qubits offer gate speeds over 1,000 times faster than competing modalities like ion traps, leveraging semiconductor industry techniques for scalability. The company plans to launch its 36-qubit system by mid-2025 and aims for a 100+ qubit system by year-end, underscoring its rapid technological roadmap.
Beyond technical achievements, strategic partnerships and government contracts bolster Rigetti's position. A substantial $100 million manufacturing deal and a $35 million equity investment from server giant Quanta validate Rigetti's modular architecture. Government backing also provides a stable revenue stream, including a $1 million DARPA award for developing "utility-scale quantum computing" and a $5.48 million Air Force consortium award for advanced chip fabrication. The company further secured three UK Innovate awards for quantum error correction. These collaborations signal confidence from both private industry and national defense initiatives, crucial for a sector still in its nascent stages of commercialization.
Despite these positives, Rigetti's financial metrics reflect the high-risk, high-reward nature of quantum investment. While its market capitalization stands at a robust $5.5 billion, Q1 2025 revenue declined over 50% year-over-year to $1.5 million. Operating expenses remain substantial, with the company operating at a loss. Rigetti's valuation hinges on future potential rather than current profitability, trading at a high price-to-sales ratio. This places immense pressure on the company to meet ambitious technological milestones and rapidly scale revenue in the coming years, transforming speculative bets into tangible commercial success.
The broader quantum computing landscape is marked by intense competition and geopolitical implications. Giants like IBM and Google, also leveraging superconducting qubits, race alongside Rigetti. The sector's projected market size varies wildly, reflecting ongoing uncertainty about widespread commercial adoption. From a geostrategic perspective, quantum computing poses both a national security threat to current encryption and an opportunity for military advancement, driving a global race in post-quantum cryptography. Rigetti's extensive patent portfolio, comprising 37 quantum computing patents, underscores its intellectual property differentiation. However, macroeconomic factors, including rising interest rates, could tighten venture capital funding for speculative high-tech ventures, adding another layer of complexity to Rigetti's path forward.
#RGTI This pattern is still consolidating within the handle, and a breakout above the resistance could signal the beginning of a new bullish wave.

Median Line Trade RGTIPrice tests the LMH and rejects it. Look for a long at the retest. We get set at 12.50.
TP1 is logical at 2.5R and just before the prior top in case we fail to follow through
TP2 is at the median line. As Dr Andrews says "Price makes it to the Median Line 80% of the time".
Ok 'we got lucky' on some news for such a quick set of T/P's. Price definitely moved quicker than expected. However it wasn't luck that put us in the position.

Chapter 3: The Big Gap Fill (RGTI) Chapter 3: The Big Gap Fill
After the luminous victory of the Alienoid Bulls in Chapter 1, the quantum lattice began to warp. Unbeknownst to them, the Mech Bears had not been defeated—only waiting, recalibrating, and evolving.
Hidden in the deep recesses of the 7D stackspace, a new war protocol had been activated: Project GAP-FILL.
Forged from the remnants of collapsed timelines and corrupted trading algorithms, the Mech Bears returned with upgraded plasma scythes, vortex cannons, and distortion shields—engineered specifically to slice through fractal bullish momentum.
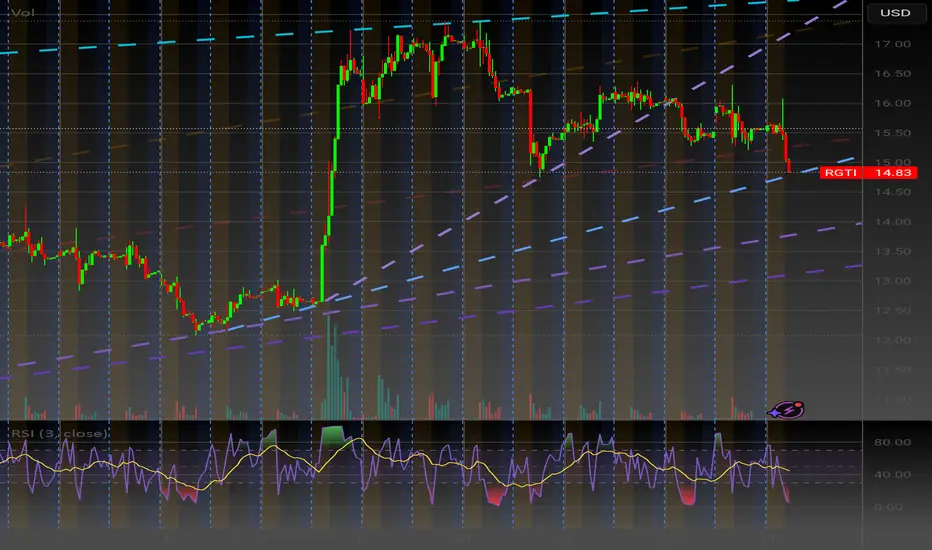
Their mission: rupture the vertical trajectory of the Bulls by targeting the exposed gap at $14.87 .
And they struck with precision.
The plasma walls cracked. Alienoid defenders were torn apart, pixel by pixel. Charts trembled. RSI indicators bled below the midline. Volume spikes echoed like sirens through algorithmic space.
The Bulls fought valiantly, but their entangled rally code had become predictable. Their once-pristine yellow pathways had begun to fade under the purple-fanged teeth of the Bears' synthetic sell walls.
$14.87 was now no longer just a price—it was a battlefield scar.
It pulsed in red, flickering like a dying star, as algorithms calculated:
→ Bounce? An emergency quantum surge from sector Theta-12 might catch the fall.
→ Or further dip? Toward the gravitational pull at $13.80... or even deeper, toward the haunted zone beneath $12.60.
Whispers from the quantum feed rippled across timelines:
“If the Bulls can't re-stabilize above $14.87, the mech horde will breach the next support sector.”
The volume candles crackled, RSI skidded down through 30, and the future became uncertain.
The Alienoid Bulls retreated to regroup, wounded but not broken, preparing for what many called…
The Great Reversal War. NASDAQ:RGTI
Possible Break-Out Chart Pattern and News RelatedUpdate to Rigetti:
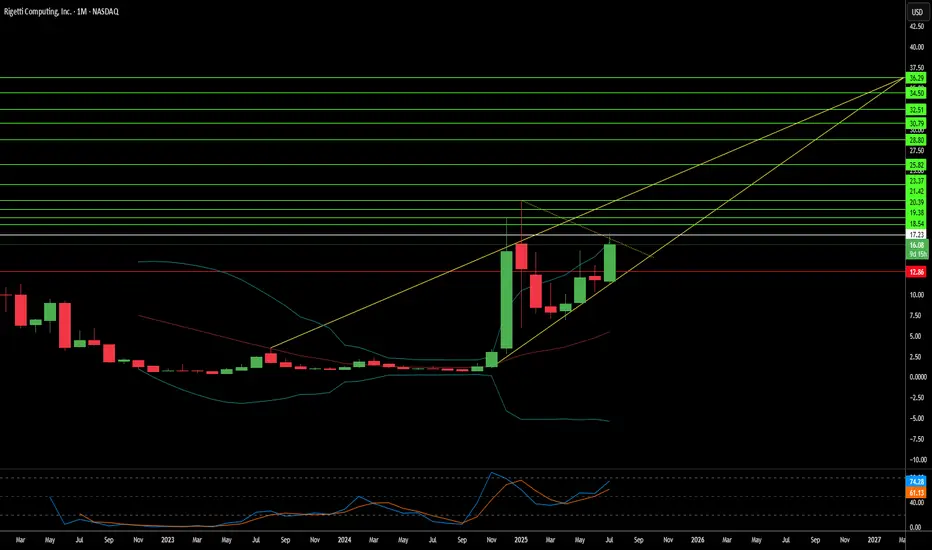
After a retest to the Fibonacci Support-Zone 0,5-0,618, we could see an impulse Movement in Wave 3 to the 1,618 Fibonnacci lvl around 24 $
News relating the new system and low error for their new qubits could launch that wave.

RGTI Heading to $17+ Good evening trading family
So currently due to price action it appears we are on our way to 17 dollar target however we expect a little bit of a correction at the 15 range.
However worst scenario if we go below 11 dollars be prepared for a sinker down to 8.
Trade Smarter Live Better
Kris/ Mindbloome Exchange

Base Setup RGTILooks like the base is finally setting up with the recent 7 week base that is much tighter than the previous deep deep base..

RGTI - Another Quatum Stock . Should i buy?Hello Everyone,
So last Quantum stock that i try to analyse today is RGTI - Rigetti Computing
First of all some figures for RGTI:
Revenue: $1.47 M — down 52% YoY and 36% QoQ
Operating Expenses: $22.1 M — up 22% YoY
Operating Loss: $21.6 M .
Net Income: +$42.6 M (+$0.15 eps) — driven by ~$62 M one-time non-cash gains .
Cash & Equivalents: ~$209 M as of Mar 31; ~$238 M by Apr 30 after $35 M investment from Quanta Government
Contracts:
DARPA Quantum Benchmarking Initiative Stage A, up to $1 M.
$5.5 M AFOSR award.
£3.5 M Innovate UK grants, including expansion of NQCC QPU from 24→36 qubits
Partnerships & Investments: $35 M strategic collaboration with Quanta Computer at ~$11.59/share
It's a high-risk, high-reward quantum play—valuable for those bullish on long-term quantum commercialization, but likely volatile near-term.
Chart Analysis:
For the time being it is stucked between 14.50 - 11.00 .
If it goes down to 9.00 $ level for me it could be the good opportunity to increase my positions.
14.15 - 14-30 is the resistance level and if this level are broken then it can quickly reach to 16.30 - 16.50 Levels.
Biggest resistance level is in 21.50 and if this level is broken then we can see 25.00 - 26.00 level very quickly.
My long term expectetion in One year maybe less it can be reach the 25.00 - 26.00 Level.
So Same as i mentioned for IONQ and QBTS , i would like to be a early investor and beginning of this year i started increase my positions some Quatum computing stocks and RGTI is one of them.
This is just my thinking and it is not invesment suggestion , please do not make any decision with my anaylsis.
Have a lovely Sunday to all.

Breakout Triangle // Gann 45° angleRigetti just broke out of the correction triangle. Also the two purple 45! gann angles hint toward an upshift. Pricetarget 1: ~16 USD // Pricetarget 2: ~24 usd // Stoploss just below 12 USD

Breakout is just a matter of time. Quantum shows a lot of interest and it looks like the major 3 all are ready to fly. IONQ, RGTI, QBTS

$RGTI Swing Trade Call Debit SpreadNASDAQ:RGTI
Buy to Open (BTO) 6/30/25 3:57pm Jul18 CDS 13/14, Paid 0.19.
Sell to Close (STC) 7/3/25 9:31am Jul18 CDS 13/14 0.38, Paid 0.19, 100 % ROI
I'm looking to Roll trade if possible.

RGTI : First Long Position AreaNASDAQ listed Rigetti Computing Inc. stock is currently trading above the 50 and 200 period moving averages.
Once it gained momentum, it later lost it but its outlook is not weak at the moment.
Right now, if the Iran-Israel war uncertainty is overcome and if there is no bad news affecting the index, the gap may close.
Risk/Reward ratio of 3.00 is a very valuable ratio to try with small position amounts.
Risk/Reward Ratio : 3.00
Stop-Loss : 9.91
Take-Profit : 18.2
Regards.

RGTI eyes on $10.29: Genesis Fib holding up the BreakOutRGTI getting a boost along with the quantum sector.
Testing a Genesis fib (albeit minor ratio) at $10.29
Look for a Break-and-Retest for any long entries.

Rigetti's Quantum Leap: Can RGTI Ride the Hype to $100?Rigetti Computing Inc. (RGTI) is a notable company in the quantum computing space, focused on developing superconducting qubit systems. As of late May 2025, the stock is trading around $14.19, marking a sharp rise from its earlier levels this year.
The stock has rallied more than 1,200% over the past six months, pushing RGTI toward the upper boundary of its current ascending channel. The $15.00–$15.50 range is acting as a psychological resistance area. After such a strong move, a technical pullback toward the $12.50 zone would be considered healthy, potentially allowing the stock to reset while remaining within its bullish structure. If $12.50 fails to hold, the next notable support sits near $7.59, a previous area of accumulation.
Rigetti’s growth outlook is supported by several key drivers:
Technological Innovation: The company is on track to roll out more advanced quantum systems, including a 36-qubit system by mid-2025 and a 100+ qubit system by year-end. These advances are built on its modular chip architecture, aimed at scaling performance.
Strategic Collaborations: Rigetti has been expanding its reach by partnering with leading cloud platforms, making its quantum systems more widely accessible and integrated with broader tech ecosystems.
Government Support: The company is also involved in government-backed quantum initiatives, strengthening its credibility and positioning in the national quantum strategy.
As the global quantum computing market continues to gain momentum, Rigetti is well-positioned to benefit. If the bullish trend persists, some forecasts suggest the stock could potentially reach the $100 level by the end of 2026.
Traders and investors should watch key levels: $12.50 and $7.59 on the downside as support, and $15.50 as the immediate resistance to confirm momentum or identify pullback opportunities.

5/14/25 :: VROCKSTAR :: $RGTI5/14/25 :: VROCKSTAR :: NASDAQ:RGTI
3 peat
- good luck to the longs
- i'll take the under, for the third time
V

100% move potential Quantum Computing RGTIRegetti Computing Inc. (RGTI) - Quantum Computing is on the move - Breaking above the 25 day EMA to continue the uptrend. RGTI has the potential to move 100% of the current price. With that potential, when would you sell at 25% , 50%, 75% or 100%? Otherwise, would you hold longterm?

RGTI | Smart Money Positioning Underway – Reaccumulation BeforePublished by: Wavervanir_International_LLC
Timeframe: 1D | Bias: Bullish Accumulation | Strategy: Smart Money Concepts (SMC) + Fib + Volume Structure
🔍 Technical Thesis
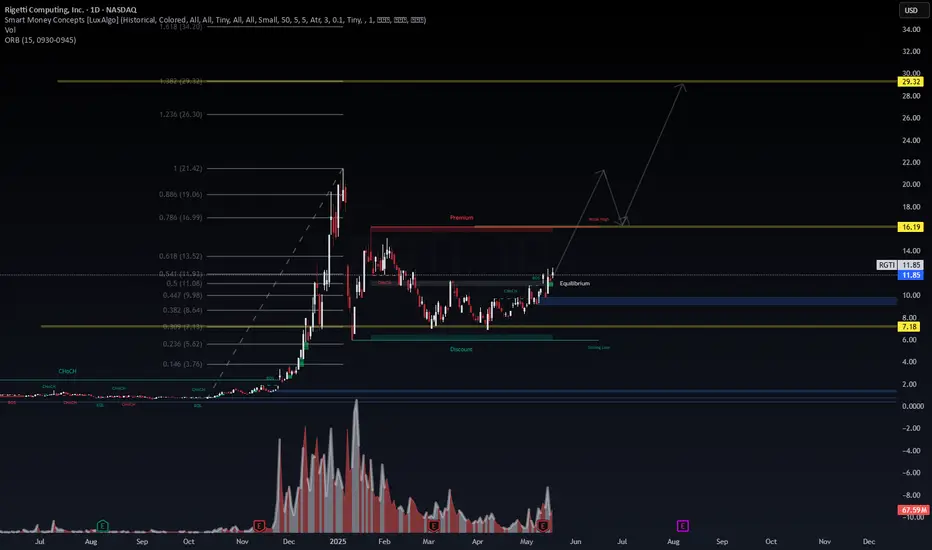
Rigetti Computing ( NASDAQ:RGTI ) is showing signs of a textbook smart money reaccumulation phase following a parabolic expansion and a subsequent controlled pullback. Volume confirms interest remains intact, with volatility compression and CHoCH signals aligning into a bullish continuation setup.
The chart structure suggests the asset has cleared the discount accumulation range (~$7.18) and is currently balancing near equilibrium (~$11.85). A move through this zone would shift market structure decisively toward premium pricing, unlocking upside targets.
📌 Key Structural Levels
Zone Price Notes
Discount Demand Zone $6.00–$7.18 Accumulation confirmed by CHoCH & BOS
Equilibrium Level ~$11.85 Current rebalancing area
Premium Target 1 $16.19 Weak High & Liquidity Magnet
Fibonacci Extension Zone $26.30–$34.20 Long-term expansion potential
Volume Spike 67.59M Institutional accumulation signal (early April–May)
📈 Scenarios
Bullish Path (Primary):
Break and retest of $13.52 (0.618 fib) leads to push toward $16.19.
Mid-term continuation to $26–$30+ zone on quantum hype or government contract announcements.
Bearish Rejection (Alternative):
Temporary fade to $9.50–$10.50 support, then reattempt equilibrium reclaim.
Invalidated if weekly closes below $7.18 demand zone.
🧠 Institutional Narrative Control:
With the quantum computing sector gaining momentum in the AI arms race, RGTI offers asymmetric upside potential. Government contracts, unique IP, and low float dynamics make this a name worth leading before the herd arrives.
📊 SMC confluence, fib retracement alignment, and psychological liquidity levels make NASDAQ:RGTI a high-conviction mid-cap growth narrative.
Expect volatility, but opportunities are rare at these structural locations.
📣 Follow for real-time updates and data-backed SMC plays.
— Wavervanir_International_LLC
#RGTI #QuantumComputing #SmartMoney #LiquidityMap #TradingView #VolumeAnalysis #InstitutionalAccumulation #FibLevels #AIInfrastructure
Chapter 1: "The Quantum Reckoning of RGTI"Inside the 7D lattice of entangled time...where markets no longer tick but pulse with the heartbeat of quantum threads...stood the great digital monument:
RGTI ,
the quantum gatekeeper.
This wasn’t just a ticker. It was a fullstack, enterprise-tier quantum computing engine used by global militaries, sovereign nations, research syndicates, and AI-led governments. The machine hummed across dimensions, calculating the future before the present even dared to arrive.
But deep within its code, two ancient forces battled: the Mech Bears , cold, calculating titans forged in the deep bearish void of logic and regression... and the Alienoid Bulls , multidimensional invaders channeling probability waves and bullish irrational exuberance through timelines that had yet to occur.
The battleground? A twisted corridor of support and resistance lines— entangled gateways linking future price realities to present action.
The blue dashed line , a fortified Bearish Citadel, had held the upper resistance quadrant at $10.60 for cycles.
The red dashed trench , the base support line around $9.00, shimmered with defense cannons and algorithmic reinforcements...it was the last fallback point of the Bulls in timelines long passed.
Between them, a vertical warpath of yellow, orange, and gray trails , fractal-stamped support gates marking where skirmishes broke out and timelines fractured.
At 4:01 PM, after market close, the earnings beacon activated .
It wasn’t just revenue—it was a revelation. Quantum contracts confirmed. Government adoption initiated. A three-year multi-quadrant deal with a trillion-dollar research consortium had been locked. The entire machine surged .
The Alienoid Bulls, cloaked in predictive plasma, launched through the yellow trajectory , obliterating the resistance gate with a warp-charged wave of volume and velocity. The Mech Bears, still defending the old blue line fortress, began to collapse under entangled pressure from multiple bullish timelines...each one showing higher and higher future valuations of RGTI across parallel universes.
The price rocketed past $10.50 .
Sparks flew across entangled reality. The gray lines buckled , their alternate timelines overwritten by the explosion of belief and momentum. Resistance became support. The next target loomed: $12.00 and beyond , where only Alienoid commanders had mapped routes.
One Bull whispered, “This isn't just a rally. It’s a NASDAQ:RGTI rewrite.”
...To be continued in Chapter 2: The Breakout Beyond the Temporal Gate...

Market Update - 5/4/2024Market is looking very solid, stocks are breaking out, leaders are leading, there is follow-through, markets are above the 50dma, breadth is the strongest it has been since 2020.
We are likely to see continued strength. Short term we might be a bit extended, I would like to see some sideways movement for 1-2 weeks before heading higher. Maybe a slight pullback to the 50dma would be healthy.
How about my portfolio? Flat for the last 2 months. Gave back all the gains I made doing stupid trades. In fact, most of my losses come from EPs which I have to admit, I don't know how to trade. I risk 3x as much on them while not even knowing how they work properly. Had I only traded breakouts this month, I could have made about 3-4% return compared to the current 0%.
So going forward, I'll put EPs on backburner, will keep studying them but not trading them. I need to master 1 setup before adding more.
I am confident I will make it. I will have setbacks for sure, I will have large drawdowns and time periods where I feel like I want to quit. But I've never felt more confident about my system and about my ability to trade, at least breakouts. I will stick to what I'm good at.

RGTI time to buy Current Price: As of May 3, 2025, RGTI is trading at $10.63, with a recent intraday high of $10.91 and a low of $9.13.
Analyst Ratings: The consensus among analysts is a "Strong Buy," with price targets ranging from $12 to $17. The average target is approximately $14.80, suggesting a potential upside of around 39% from the current price

Weekly Descending TriangleThis is a bearish set up. Descending triangles are more prone to price break downs. Notice the rejection of the 10 EMA and the trendline. Last time price rejected the trend line there was more bearish action. Volume is also decreasing.Price needs strong upward movement from the 10 EMA the 9.17 price area, and a clean break upward from the trendline. If price breaks downward from this consolidation; price can probably reach the 6.11 price area. You can drop to a lower time frame maybe (1 Day or 4 Hours) and see how price responds to the trendline and the other key levels for possible early entries/exits.
