RIVN weekly breakdownRIVN settled this week after a much awaited sell off from the local top put in during the last tech bull run. Stochastic has turned over signaling a retreat from being oversold. Indicators are pointing to RIVN having more downside to fill in the gaps created on the last bull run. Id like to see a retest of this weeks high before grabbing puts, but any breakdown from this weeks low and we will see the gaps get filled.
RIVN trade ideas

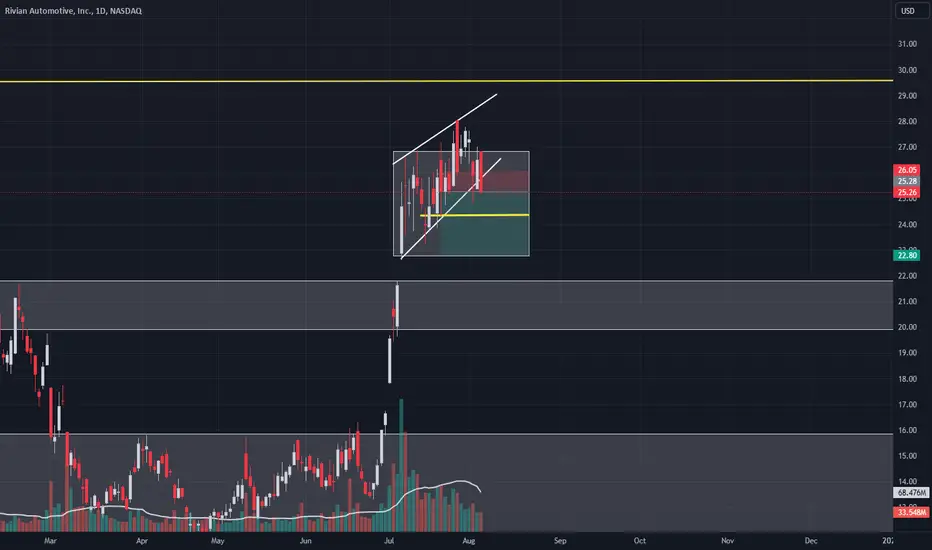
RIVN, buy nowEMA 100, light blue line was resistance this time last year, rejected 4 times. we broke this resistance in june. we're now bouncing off it in august. buckle up

Bullish For Potential Short Term UpsideAfter good earnings last week and a small consolidation, reaching $20.22 low today and maintaining above the 100 EMA, I decided to go long for a swing.
My position is at $20.86, looking bullish for a 10% upside while potentially reaching to the 50 EMA, 200 EMA, and 20 EMA.
Another potential upside is to go even higher to 28%, reaching the higher resistance level. Though I don't feel too comfortable about it as there is no strong enough support and resistance area above the 10% upside area I'm looking for. If you feel different and found something else I'd love to learn and discuss it.
I have a stop loss at $18.93. Will update you further on the outcome.

Long ideea RivianRivian had good earnings.
Nice consolidation on a down trend looking for a rejection of 19.61 and 21.15 for a possible reversal to 28.00

Fibonacci Trading And Price Action RIVNEstablish a Fibonacci price cluster with important resistance.
Set up price clusters for a clear buy, stop loss, take profit point. I will add Fibonacci timing to see the possibility at which point the price could touch the set point.
You should enter an order with a suitable volume for your account, and leave your stop loss at least the breakeven point.

Short trade idea for RivianTrade idea mention on chart. Entered in to trade a little late as I was away.
Will cut trade which ever way it goes just before earning.
Still holding a long term bag.

RIVN Rivian AutomotiveIn July, there was a strong demand for the stock, which led to a period of consolidation. Following this consolidation phase, there was a breakout above the level of 27. This breakout indicates a potential continuation of the upward movement and may suggest further buying interest in the stock.
SL 22.5
tp1 31.5 tp2 39.5

Rivian Update: Ending Diagonal I decided to check back in on Rivian today and see what progress we had made to form a top. It appears to me it is ending in a diagonal. If this line of thinking is correct, then I would expect the end of wave ((5)) to hit somewhere between $28-$30 or so. After this it would have a very steep decline that usually ends where it began...@ $23. If you don't have a stop limit set, I would strongly advise you create one. When that A wave pops, it will catch many off guard and leave little time to react.
I have alerts set and will be watching for it to top soon. Once the decline starts, I will begin to track it again. Until then, good luck everyone.
Bonam Fortunam,
--Tyler

Oh Rivy is it time to fill your gaps so for the past 5 days, she couldn't hang outside the box, forming a nice wedge. I will ride NASDAQ:RIVN down to 24 and wait if price consolidate and if there are no buyer then all the way at the bottom of the box. Hopefully this week we touch one gap but market is not about your opinion sometimes, price action tells the story.
Consolidation in wave 4.Wave 4's purpose is to correct and consolidate the price movement from Wave 3 before the trend resumes with Wave 5. Traders and analysts use Elliott Wave Theory to try to anticipate potential price levels for the end of Wave 4 and the subsequent start of Wave 5, but it's important to note that Elliott Wave analysis can be subjective and open to interpretation
Alt count provided

RIVN Rivian Automotive Options Ahead of EarningsIf you haven`t sold RIVN on the recalls:
Or last time ahead of earnings:
Then Analyzing the options chain and the chart patterns of UPWK Upwork prior to the earnings report this week,
I would consider purchasing the 10usd strike price Calls with
an expiration date of 2024-1-19,
for a premium of approximately $1.92.
If these options prove to be profitable prior to the earnings release, I would sell at least half of them.
Looking forward to read your opinion about it.


$NASDAQ:RIVN Tight flag accumulationNASDAQ:RIVN forming a tight flag accumulation with EMA8 confirmation and RSI above 70 this might have a climax run by nextweek.

RIVN - Coiling Stock🚀NASDAQ:RIVN is coiling on massive volume! The volume is dwindling, hinting at a possible breakout on the horizon Fingers crossed for the bulls! This is the hottest stock right now in my opinion. Lets see how it unfolds. My first target is at 30$.

RIVN RangeUsing wyckoff theory... Waiting for a break of the range and a retest. We're at a point in the range where things get choppy just before the break so be mindful. For the upside, id be looking at $30 as an area of resistance and $20 on the downside as support

Rivian clearing weekly resistance!Looks like Rivian may have more upside as price has opened above weekly resistance. Next weekly target is $40. Lose the weekly level @ $24 and I’d look for more downside. As a note this means a weekly candle close below $24 and this trade is negated.

RIVIAN to $30 or $15?RIVN we can have 2 scenarios with. The count I have drawn is bullish and that we are going to be pushing higher if W4 has ended, which technically it could be over with since we hit the 0.236 and pushed higher off of it. Even if we push lower to the 0.382 or even the 0.5 level that can still be a W4 correction from W3. As of now, I am going to stick with that the W4 we are in right now and trying to push to W5 higher.
If we fall from here then this count would be an ABC correction and we will continue to make new lower lows as the overall trend is still down.

$RIVN NASDAQ:RIVN - On Thursday, July 20, 2023, Rivian Automotive experienced a 3.95% increase in its stock price, rising from $24.83 to $25.81. This marked the third consecutive day of gains for the stock, and investors are eagerly watching to see if the upward momentum will continue or if there might be a minor pause in the coming days. Throughout the trading day, the stock's price fluctuated significantly, ranging from a low of $23.85 to a high of $26.14, indicating substantial market activity.
Over the last 10 days, the stock has seen increases in 6 of them, resulting in an overall gain of 19.38% over the past two weeks. The trading volume also saw a notable increase on the last day, alongside the rising price, which is considered a positive technical sign. Approximately 25 million more shares were traded compared to the previous day, with a total of 79 million shares exchanged, amounting to approximately $2.04 billion in transactions.
Currently, the stock is situated in the upper part of a very wide and strong rising trend in the short term, presenting a potential selling opportunity for short-term traders, as a reaction back towards the lower part of the trend might be anticipated. A break above the top trend line at $27.07 would indicate an even stronger rate of ascent.
Based on the current short-term trend, the stock is projected to rise by 76.81% over the next three months, with a 90% probability of holding a price between $29.57 and $47.86 at the end of this three-month period.
In terms of technical analysis, the Rivian Automotive stock holds buy signals from both short and long-term Moving Averages, signaling a positive forecast. Additionally, the relationship between the two signals, with the short-term average above the long-term average, further supports a buy signal. On potential corrections downward, there may be support from the lines at $25.08 and $18.10. However, a breakdown below any of these levels would issue sell signals.
Furthermore, there is a buy signal from the 3-month Moving Average Convergence Divergence (MACD), and the rising volume along with the price is considered a good technical signal. However, some negative signals were also issued, which could have some influence on the near short-term development. A sell signal was issued from a pivot top point on Wednesday, July 12, 2023, resulting in a decline of -0.386% thus far. Further fall is indicated until a new bottom pivot is found.
As with any investment decision, it's essential for investors to conduct thorough research and analysis before making any financial moves. While the recent performance of the stock appears positive, it's crucial to assess the company's fundamentals and market conditions before making any investment choices.

Dont let the cat out of the box $RIVN lolI like this game of probabilities lol, whenever the cat is out the box it will blow huge so you better buy while its inside so when the tip is out then you up like never before. Thats an A+ set up so follow price action.

Macro reverse actionIf i get all 5 waves here, corrective pattern should be longed for a long term hold.Perhaps at the end of the year we will have more clearence.
Again, traditional assets much better when it comes to a clean EW pattern

RIVN is showing a pullback for a long entryRIVN on the 2H chart rose 67% to begin July as part of the larger EV sector rally
which included several other tickers including those from UK and China. It has
pulled back significantly since completing a double top on July 13th. Price is
now hovering over and supported by the mean VWAP line anchored to July 1st.
The two time frame RSI indicator shows both lower (blue line) ane higher time
frame ( black line) RSIs at 50 or higher with the blue line closer to that transition
zone. The zero-lag MACD shows the subtle cross under the histogram which
has changed from negative to positive. Overall, although the best entry is at
$20 from a very deep pullback, I believe that RIVN is now setup for a long trade
following a continuation or even a call option contracts trade. I will take a
position in call options at this time.

Rivian 'Dead Cat Bounce' Over?I have been getting a lot of questions from followers about NASDAQ:RIVN in recent weeks. One of the favorites of the 2021 EV stock craze the share price has done not performed well since the IPO. This recent very bullish move has gotten a lot of attention but I think it has come to an end.
Price Action
Like most of my setups I am looking at RIVN hitting a major 50% Retracement this one being from the downtrend starting in September 2022 through April 2023. That Resistance at 26.71 was hit yesterday and today's price action shows reluctance to test and break it. I have been looking for a pullback to this bull trend to its own 50% Retracement at around ~20 and it may be upon us.
The Trade
Earnings are coming up on August 8th. That sets up a nice window for monthly options of the August 18th expiration. Since 20 is the approximate pullback level it also makes for a proper strike. That means Aug23 20 Puts will be the choice to express the trade. If price breaks the recent high I may look to cut them as they should maintain their premium with earnings getting closer. I also do not typically hold through earnings but rather try to close the day before to avoid the 50/50 probability of the binary event.
The Narrative
I still see the occasional Rivian on the road but as of late I have become a Tesla Maxi. Tesla had record production and delivery for Q2 2023 but every other EV manufacturer is struggling according to recent reports. The market as a whole has enjoyed an optimistic bull run since March and is due for a pullback.

$RIVN Ready for the next move?? I'm long here but it could just as easily breakdown. The reason why I'm long is because we are in an uptrend and the chart pattern looks bullish (to me) . The risk is a little higher here because of the 50/50 chance it goes either way, pay attention and keep your stop loss TIGHT.
