RIVN trade ideas

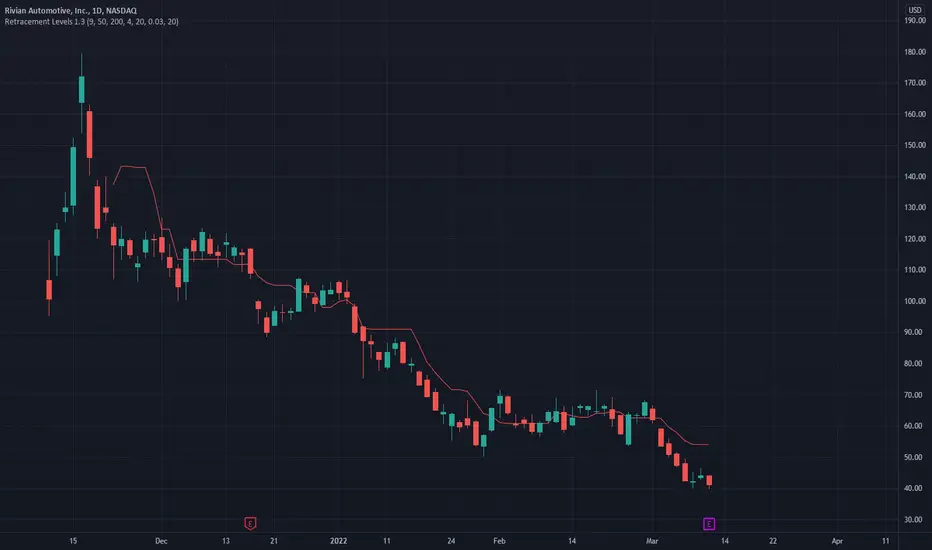
RIVN: Deep Value PlayOkay, this one is a bit different than my normal charts. Rivian Automotive only started trading late November of last year so there's not enough historical data to draw from to give a complete picture. However, RIVN is a high-profile startup in a hot industry with motivated billionaires backing it. It wants to be TSLA, but you wouldn't know it based on the 50% price discount from its IPO. Despite it's gloomy performance--or perhaps *because* of it--it's actually looking like an attractive buy at these prices. It appears to be in my buy zone, and there's bullish divergence, but there's not enough data to show me where the momentum/pressure is. I think this is a great value play for a long-term investor.
Good Luck
----------------------------------------------------------------
These are my personal views and not financial advice. Please do your own research before investing.
I'd love to hear your thoughts, ideas and feedback. Feel free to Comment and I'll try and get back to you quickly.
If you appreciated this analysis, consider Liking or Following . Thanks!


RIVN: The technical point that will trigger a reversal!Hello traders and investors! Let’s see how RIVN is doing today!
For the first time since March 30, RIVN is trying to reverse the trend. This reaction is quite good, which is surprising, considering it is a Red Monday, and it is a sign of strength.
Technically speaking, this movement is very interesting. As RIVN just retested the $ 37.61 area as a support again, making it a possible Double Bottom, and it is trying to break the resistance at $ 41.
If RIVN closes above the $ 41 today, it might confirm this pattern. So far, all we see is lower highs/lows, indicating a strong bear trend. However, by defeating the $ 41, it’ll do something new, and this is a good sign of a reversal. We must not lose the $ 37.61, otherwise, RIVN will frustrate this delicate bullish structure.
In the daily chart, it seems RIVN just dropped to fill the gap at $ 37.32, and now it is reacting nicely. If it confirms the bullish structure in the 1h chart, the next resistance to work with is the $ 56.76. Above that point, we have an open gap at $ 60.80 that might help to attract the price to higher levels.
Let’s see how RIVN will close today, and if it’ll keep above the $ 41 area. To me, RIVN looks interesting, so I’ll keep you guys updated on this. Therefore, remember to follow me to not miss any of my future analyses!

Rivian $RIVN BullRivian please don't fail me this time. I have set another long on RIVN. My last Rivian long call was my most hated post. But the haters were right :( . This time the bears and haters will face serious retribution.

$RIVN PUTS -Looking to play the continuation of this current trend
-Going to wait for a pullback monday before getting into puts
-will be looking for 30-40% on options

RIVN you can still buy it cheaper than Soros If you haven`t bought the all time low here:
then you should know that you can still buy cheaper than George Soros.
Billionaire investor George Soros bought a $2 billion stake in electric truck startup Rivian in the quarter ended Dec. 31.
His average should be around $100.
My short term price target is 69.50.
Looking forward to read your opinion about it.

RIVN gaining some momentumIt does not have the perfect characteristics of an alpha stock, but has some potential. Price has an alpha action and the volume is not so bad. Keep an eye on it on a pullback.

$RIVN - Quick long play before potential short tradeprice has broken upward out of a consolidation period, suggesting a continuation of the prior uptrend. simple risk reward with support/resistance with potential call option. Tight stop loss. any weakness at open could flip to short position.

RIVENHead and Shoulders and there is a resistance.
The targets on the chart and the stop are closing candles 1d below the blue line

$RIVN wants lower. Low to mid-20s? Or even lower?If we look at the chart, $RIVN seems to be making lower highs and lower lows.
This recent move up was just a retest of resistance at $47. On top of that, on lower timeframes (2hr), we seemed to have formed a double top.
This leads me to believe we're about to see another leg lower. If Rivn falls from here and loses the $37 support, I think it's likely that we'll see the low to mid 20 range. Supports on the chart.
After that, I can see RIVN bouncing, but eventually I think it could see the $8 range before reversing it's trend back to bullish.
Let's see how the next few weeks and months play out.

RIVN 3/21/22RIVN
Another easy short trade
Price in existing downtrend
Price entered sideways range between 53-67
Price broke down from this range to start continuation of downtrend.
Price has pulled back to dynamic resistance in 20 ema. Price in area of value, my cue to enter trade
Entering trade short.
Entry: 42.91
Stop loss: trailing 20ema
Target: trailing 10ema


How long will it take Rivian to get back to its IPO price?Rivian Automotive (NASDAQ: RIVN), the budding electric vehicle maker, initially bank-rolled by the likes of Ford (NYSE: F) and Amazon (NASDAQ: AMZN), is currently trading 80% lower than its peak since listing on the Nasdaq stock exchange.
Bear in mind that Rivian was listed on the Nasdaq in November 2021, when you had to be very unlucky not to make money in the stock market, especially as a company working in the electric vehicle domain. In a sign of the jubilant (and bygone?) era, within days of listing, investor exuberance had pushed RIVN up by 115%, to US $170 per share. RIVN’s market electricity has fizzled in the following five months and could do with a recharge.
The Rivian stock price is currently trading very close to an all-time low, at US $37.00, 80% lower than its all-time high. In contrast, Tesla (NASDAQ: TSLA), a company which Rivian investors hope can be emulated, is trading 25% lower than its all-time high (US $1,200 vs US $900), which it reached in November 2021 (roughly the same time Rivian reached its all-time high).
RIV only just begun
As illustrated by its latest earnings call, Rivian has a momentous scope for growth.
In its Full Year 2021 earnings call, which was released on March 10, 2022, Rivian reported its first bout of revenue, a tiny US $55 million against a cost of revenue of US $520 million and other operating expenses (mainly R&D and administration) of US $3.7 billion. Consequently, Rivian reported a total net loss (inclusive of all costs) of US $4.7 billion for the full year.
The massive discrepancy between the company’s revenue and costs is a natural part of its growing pains. The automobile industry’s huge barrier to entry means that Rivian expects to be making a net loss for some time. However, it does expect to be profit-neutral by the end of the next financial year, and this might be what is more important for investors following the company.
No fast-charging solution
Rivian is still valued at over US $30 billion and far from a bust. However, it will perhaps take years for the company to charge its stock price back up to its IPO price of US $78.00. Even in the age of outsized valuations for EV companies and some residual investor exuberance in the market, investor confidence is butting up against obstacles such as the infamous chip-shortage affecting numerous car companies and tightening monetary policy from the US Federal Reserve.
To hasten the process and to overcome some of these obstacles on its way back to its IPO price, Rivian may have make better use of its US $18 billion cash reserve and carve out more than its planned 10% takeover of the EV market by 2030.
As it stands, Rivian’s total theoretical capacity at its two factories (600K) could garner 10% of the 2021 electric vehicle market. However, By 2030, electric vehicles sales are predicted to account for 1-in-2 vehicles sold, from a current 1-in-10. To account for 10% of all EVs sold in 2030, Rivian will have to boost production capacity to approximately 3 million vehicles per year.
For interest, Rivian generated its 2021 revenue of US $55 million on delivery of 2500 electric vehicles. The company’s guidance for 2022 expects to deliver 25K vehicles, which is a huge increase on its current production numbers, but fantastically far from the number of pre-orders on its books (83K) and unimaginably far from its 10% goal of 3 million.


Rivian RefreshMan, Rivian deserves to sit lower than this based on financials and returns, but if this market has one more long leg in it to exhaustion of overbullish idiots, well, then this is the path.

RIVN TargetI did this for GOTU one time and it actually exceeded the target. Anyways, equal length arrows for the bear flag target, which comes to around $12.5
Probably won't tank as fast as the initial drop, but the end target is usually close. Of course, the end play here is probably bankruptcy which is zero.
25k vehicle production, trading at half the market cap of GM and Ford. The market is stupid.

Buy RIVN cheaper than George SorosBillionaire investor George Soros bought a $2 billion stake in electric truck startup Rivian in the quarter ended Dec. 31.
His average should be around $100.
RIVN 52 Week Range $37.50 - 179.47, today hitting all time low.
I see this as a potential buy opportunity.
My price target is $65.
Looking forward to read your opinion about it.

Rivian All Time LowRivian NASDAQ:RIVN is at an all time low right before earnings. "I want to own some of this company" is my general thesis as they build out their infrastructure sans sales. We'll see if this contrarian buy of shares pays off...
How far Rivian Could go ???(2)On December 9th, 2021 when RIVN was 116.5 I put the target on 60-40 in the next couple of months..!
11 days after that I recommended shorting RIVN would be the best among TSLA, LCID, and RIVN..!
Today RIVN touched 39.86..!
But I think it will go lower after the earning because it did not sell anything..!
Why?
Because it did not produce anything to sell..!
I think it will experience single-digit prices in 2022..!
For short opportunity let first people cover the previous shorts in March..!
Best,
Dr. Moshkelgosha M.D
DISCLAIMER
I’m not a certified financial planner/advisor, a certified financial analyst, an economist, a CPA, an accountant, or a lawyer. I’m not a finance professional through formal education. The contents on this site are for informational purposes only and do not constitute financial, accounting, or legal advice. I can’t promise that the information shared on my posts is appropriate for you or anyone else. By using this site, you agree to hold me harmless from any ramifications, financial or otherwise, that occur to you as a result of acting on information found on this site.

How Low Rivian could go???I think the RIVN chart pattern is very similar to HOOD and it could follow the very ae pattern and experience a sharp constant drop to 60-40 in a Bearish case..!
You may think you have bought the next Tesla but Rivian can not be the next Tesla..!
You can see the most important support (green lines) and resistance (red lines) to watch in the coming days in these charts!
Best,
Moshkelgosha
DISCLAIMER
I’m not a certified financial planner/advisor, a certified financial analyst, an economist, a CPA, an accountant, or a lawyer. I’m not a finance professional through formal education. The contents on this site are for informational purposes only and do not constitute financial, accounting, or legal advice. I can’t promise that the information shared on my posts is appropriate for you or anyone else. By using this site, you agree to hold me harmless from any ramifications, financial or otherwise, that occur to you as a result of acting on information found on this site.

New Target for RIVNWhen I compared Rivian with Hood 43 days ago it was 115, I set my target for 60 and now with the current momentum, I think there is potential to go to 30-40 or even lower!
Best,
Moshkelgosha
DISCLAIMER
I’m not a certified financial planner/advisor, a certified financial analyst, an economist, a CPA, an accountant, or a lawyer. I’m not a finance professional through formal education. The contents on this site are for informational purposes only and do not constitute financial, accounting, or legal advice. I can’t promise that the information shared on my posts is appropriate for you or anyone else. By using this site, you agree to hold me harmless from any ramifications, financial or otherwise, that occur to you as a result of acting on information found on this site.

Rivian price action on the reversal of the market to longFib channel projection is an estimate, but it's based on all the key trend lines and levels that were tested on the way down. Safe investing in anything would wait for the spike and the pull back into April or May for buying. Purchasing the next dip is a "catching the knife" scenario. However, Rivian is showing a strong accumulation. The final push will be unclear. But I think my chart is accurate and will be going in at 35 or so.
