RMBS ready to RHOMBUSThis is a lot like the ACLS play... Product suppliers for chips silicon IOT market... Fits all criteria, and has gone under the radar for some time now, ready to fulfill it potential. BUY
RMBS trade ideas

$RMBS looks good to go higher, unsure when earnings...$RMBS looks good to go higher, unsure when earnings...

Ultimate Stock Indicator flashes BUY signal for Rambus Inc!$RMBS is hardly talked about, under the shadows of $MU and $TSM.
Feb 1st is their earnings. Look for a great runup and potential shoot the moon AFTER earnings.
To find out more about the Ultimate Stock Indicator Pro, click my calendar to setup a quick Zoom meeting!

Rambus Announces New Stock Repurchase Program!!!RMBS: Rambus Inc.
2020-11-02 16:05:00
Rambus Announces New Stock Repurchase Program
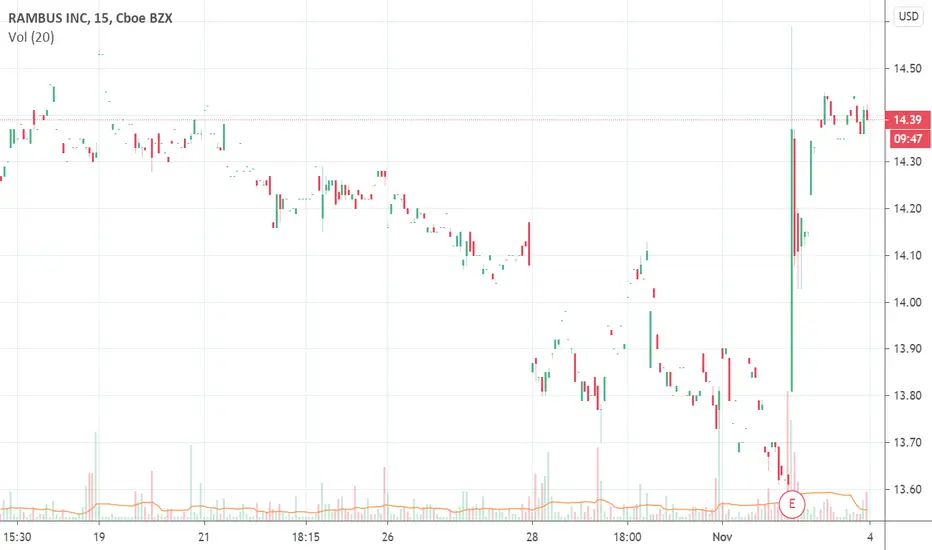
RAMBUS on breakout watch post earnings
Golden cross Imminent
Just Under major breakout level.
MACD bullish cross complete.
RSI in strong uptrend with room to run higher.
Alert set for $16.
Company Profile
Rambus, Inc. engages in the provision of cutting-edge semiconductor and Internet Protocol products, spanning memory and interfaces to security, smart sensors and lighting. It operates through the following segments: Memory and Interfaces Division (MID), Cryptography Research (CRD), Emerging Solutions Division (ESD), and Lighting and Display Technologies (LDT). The MID segment focuses on mobile memory, server-based memory, serial link designs and custom solutions. The CRD segment comprises of chip and system security, anti-counterfeiting, smart ticketing and mobile payments. The ESD segment includes computational sensing and imaging group in the area of emerging technologies. The LDT segment covers the design, development, and licensing of technologies for lighting. The company was founded by P. Michael Farmwald and Mark A. Horowitz in March 1990 and is headquartered in Sunnyvale, CA.
PLEASE GIVE US A LIKE IF YOU FIND OUR CONTENT HELPFUL, IT IS REALLY APPRECIATED


Option traders bet on 50% upside in Rambus====Entry level $16 - Target price $24====
Rambus, Inc. engages in the provision of cutting-edge semiconductor and Internet Protocol products, spanning memory and interfaces to security, smart sensors and lighting. It operates through the following segments: Memory and Interfaces Division (MID), Cryptography Research (CRD), Emerging Solutions Division (ESD), and Lighting and Display Technologies (LDT). The MID segment focuses on mobile memory, server-based memory, serial link designs and custom solutions. The CRD segment comprises of chip and system security, anti-counterfeiting, smart ticketing and mobile payments. The ESD segment includes computational sensing and imaging group in the area of emerging technologies. The LDT segment covers the design, development, and licensing of technologies for lighting. The company was founded by P. Michael Farmwald and Mark A. Horowitz in March 1990 and is headquartered in Sunnyvale, CA.

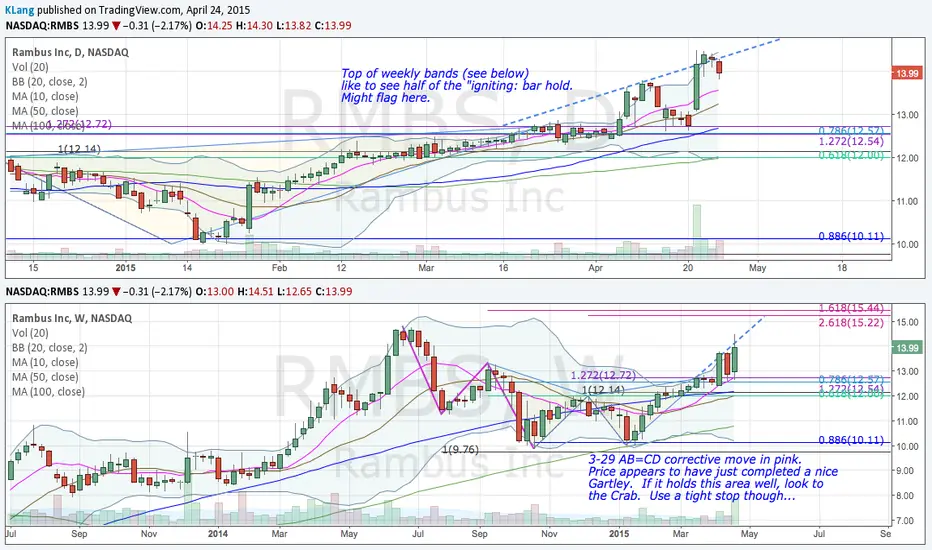
An Opportunity To Get Long RMBSSince breaking out of its extended rectangle consolidation, semi conductor play $RMBS has come back to retest the breakout area, forming a falling wedge pattern into good volume profile support. I like it as a long here to retest its most recent highs. I'll be looking to take a long here on any pullback.

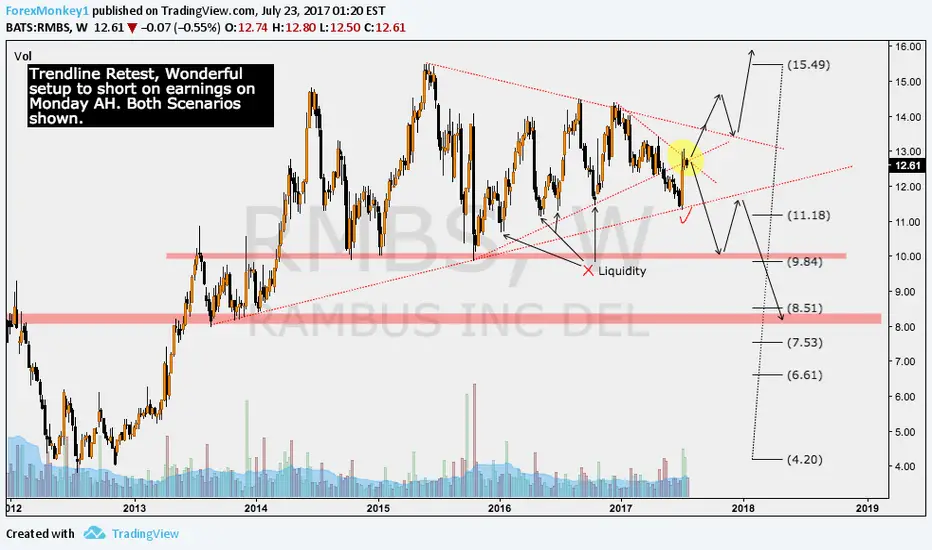
RMBS- Potential Short setup to as low as $9.24 Waiting for a rally to resistance or preferably, a break down below support.

RMBS – upward channel, seems ready to breakRMBS – upward channel, seems ready to break
Trade Criteria
Entry Target Criteria- Break of $13.60
Exit Target Criteria- $11.83
Stop Loss Criteria- $14:70
Option $15 May/Jun/Jul Puts
You can check detailed analysis on RMBS in the trading room/ Executive summary link here-
www.youtube.com
Time Span- 13:00"
Trade Status: Pending
We checked further in Thursday Live Trading room (only available to subscribers)
(Note: Trade update is delayed here. To get updated & get new Trade Ideas - Please subscribe to our Newsletter at: acornwealthcorp.com/gold)

RMBS - To short at the break of 11.57RMBS was a good success from our Big one class & it is in the profit tracking area. However, there seems a secondary trade opportunity if it breaks below the support area & breaks below 11.57
We would also consider $12 January puts
You can check our detailed analysis on RMBS in the trading room/ Executive summary link here-
www.youtube.com
Time Span: 5:15 "
Trade Status: Pending

RMBS- We are looking for Nov16- 11 put (0.56)FMBS has 2 head &shoulder pattern forming & both suggesting a decline.
We can see a decline from 11 up to 5 in long run.
We are looking to trade it with Nov16- 11 put (0.56)

RMBS Potential ShortI have been following this stock for a long time and have made great returns with it. The pattern scheme between the chart and the RSI can be used to predict an upcoming downtrend in the price of RMBS. Once the RSI exceeds 75 the chart bounces as the RSI levels out. This leveling out process takes about 20 bars (1 D) and then drops again. The MACD is also showing bearish signs. Any feedback or suggestions would be greatly appreciated!
Also:
Many of the drawings were done prior to movement in the chart. For example, my prediction of the "Stop Fall" in green was done prior to the chart actually stopping at the line.


My beloved ChannelIf price manage to break the neckline, my sell order will be waiting at the channel top
