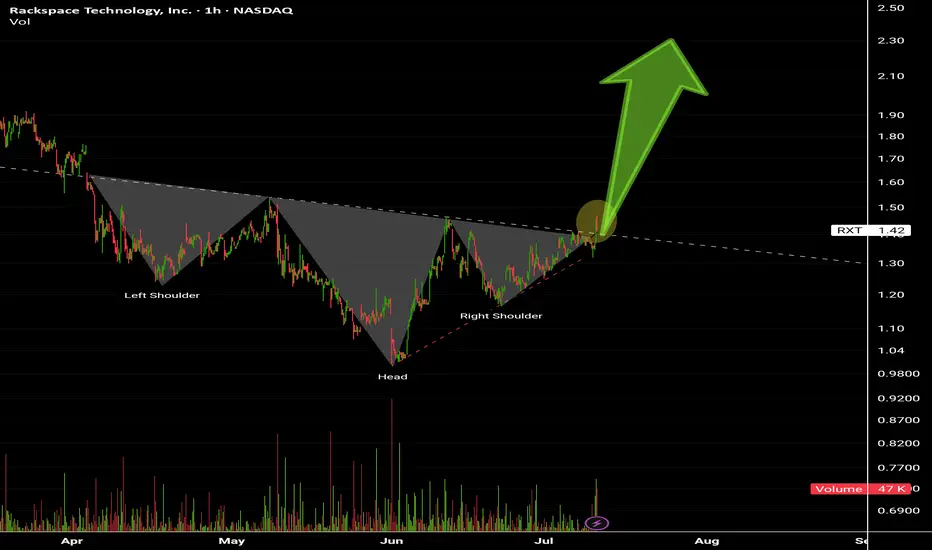
Rackspace Technology inc Inverted Head and Shoulders pattern.
Breaking 1.42$ Today.
Target price above 2.2$ .
Next report date
—
Report period
—
EPS estimate
—
Revenue estimate
—
−1.29 USD
−858.20 M USD
2.74 B USD
61.48 M
About Rackspace Technology, Inc.
Sector
Industry
CEO
Amar Mandanna Maletira
Website
Headquarters
San Antonio
Founded
1998
FIGI
BBG00W0JYQQ4
Rackspace Technology, Inc. engages in the provision of end-to-end multi-cloud technology services. The firm designs, builds and operates its customers’ cloud environments across technology platforms. It operates through the following segments: Multicloud Services and Apps & Cross Platform. The Multicloud Services segment includes public and private cloud managed services offerings, as well as professional services related to designing and building multicloud solutions and cloud-native applications. The Apps & Cross Platform segment includes managed applications, managed security and data services, as well as professional services related to designing and implementing application, security and data services. The company was founded on July 21, 2016 and is headquartered in San Antonio, TX.
Related stocks
Rackspace Technology inc Stock in Triggering level 💯 , 1st Target prices zone between 2.88$ - 3.03$
Stock on Inverted Head and Shoulders pattern at the bottom, And Target prices zone between 5.02$ - 5.76$ ( Resistance level).
Highly recommended for Buy 👌

The Big Beautiful RXTWith the bill passing and TA indicators popping up. I see these long term channels starting to break and the entire price action start to flip to the other side.
Watch the break and retest, especially if we see a spike in volume soon.
Really hard to lose long term with this one.

Rackspace Technology inc Inverted Bottom Head & Shoulders pattern.
Target price = 1.91$ and much more .
Hint : Volume increases Today above 10 millions.
Highly recommended for Buying ASAP 👌

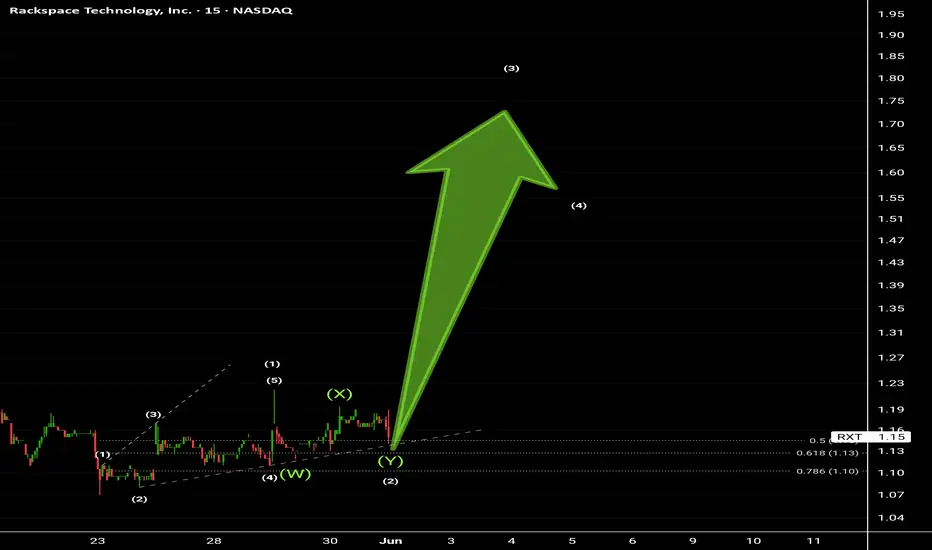
Rackspace Technology inc The Stock completed 5 correction waves , 👋 ( Elliott wave Analysis ) .
Now expected ABC Zigzag upto 16$ or could be more 75% of Top to Bottom.
Highly recommended for Buying from present prices 👌 The best price ever.
Buy it as much as you can now 🔊🔊🔊🔊

Rackspace Technology inc The Stock completed 5 waves correction.
We are Expecting at least going between 50% from all long way top to bottom .
Target prices in the zone between 14$ - 16$.
Massive news Expected soon that will Trigger the stock's price up to that level .
Highly recommended for Buying now 👌

Rackspace Technology inc Inverted Head and Shoulders bottom pattern formed.
Target prices on chart.
Highly recommended for Buying now.
Very high Target prices will be announced later 💯💣💣💣🔥

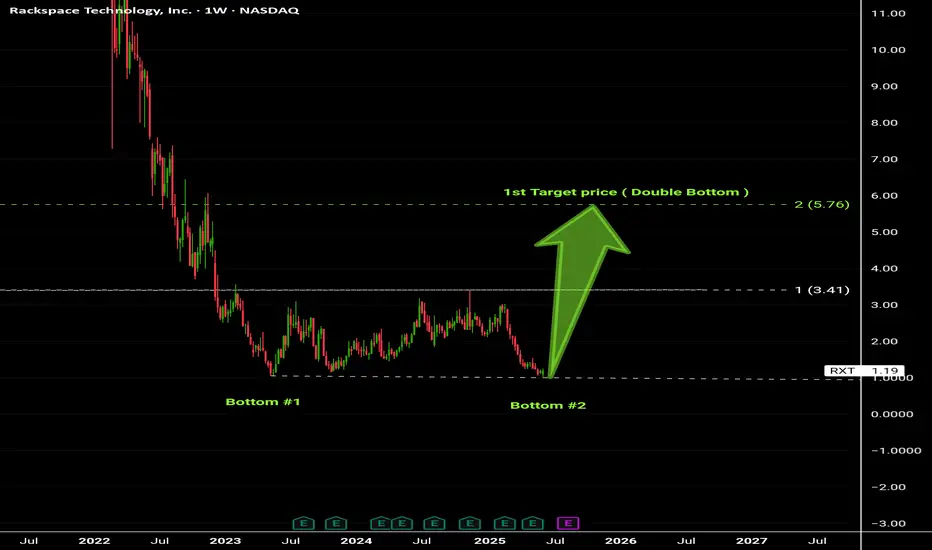
Rackspace Technology inc Double Bottom pattern at the bottom formed .
Target price of the pattern = 5.67 $ - 6.00 $
Higher Target prices will be explained latter .
Rackspace Technology inc Wave bottom completed in ABCD pattern
Target price 1.35$ , Any breaking up, it will trigger to 2.30$ and above .
Highly recommended for Buying now .

Rackspace Technology inc 3rd Motive powerful wave next week to start .
Buy it now.
Target prices above 2 $
Major Target price 17$ - 23$ .
See all ideas
Summarizing what the indicators are suggesting.
Neutral
SellBuy
Strong sellStrong buy
Strong sellSellNeutralBuyStrong buy
Neutral
SellBuy
Strong sellStrong buy
Strong sellSellNeutralBuyStrong buy
Neutral
SellBuy
Strong sellStrong buy
Strong sellSellNeutralBuyStrong buy
An aggregate view of professional's ratings.
Neutral
SellBuy
Strong sellStrong buy
Strong sellSellNeutralBuyStrong buy
Neutral
SellBuy
Strong sellStrong buy
Strong sellSellNeutralBuyStrong buy
Neutral
SellBuy
Strong sellStrong buy
Strong sellSellNeutralBuyStrong buy
Displays a symbol's price movements over previous years to identify recurring trends.
Frequently Asked Questions
The current price of RXT is 1.45 USD — it has decreased by −4.61% in the past 24 hours. Watch Rackspace Technology, Inc. stock price performance more closely on the chart.
Depending on the exchange, the stock ticker may vary. For instance, on NASDAQ exchange Rackspace Technology, Inc. stocks are traded under the ticker RXT.
RXT stock has risen by 8.21% compared to the previous week, the month change is a 14.17% rise, over the last year Rackspace Technology, Inc. has showed a −42.46% decrease.
We've gathered analysts' opinions on Rackspace Technology, Inc. future price: according to them, RXT price has a max estimate of 2.00 USD and a min estimate of 1.00 USD. Watch RXT chart and read a more detailed Rackspace Technology, Inc. stock forecast: see what analysts think of Rackspace Technology, Inc. and suggest that you do with its stocks.
RXT stock is 8.28% volatile and has beta coefficient of 1.61. Track Rackspace Technology, Inc. stock price on the chart and check out the list of the most volatile stocks — is Rackspace Technology, Inc. there?
Today Rackspace Technology, Inc. has the market capitalization of 344.21 M, it has increased by 9.35% over the last week.
Yes, you can track Rackspace Technology, Inc. financials in yearly and quarterly reports right on TradingView.
Rackspace Technology, Inc. is going to release the next earnings report on Aug 7, 2025. Keep track of upcoming events with our Earnings Calendar.
RXT earnings for the last quarter are −0.06 USD per share, whereas the estimation was −0.08 USD resulting in a 26.15% surprise. The estimated earnings for the next quarter are −0.05 USD per share. See more details about Rackspace Technology, Inc. earnings.
Rackspace Technology, Inc. revenue for the last quarter amounts to 665.40 M USD, despite the estimated figure of 658.18 M USD. In the next quarter, revenue is expected to reach 659.40 M USD.
RXT net income for the last quarter is −71.50 M USD, while the quarter before that showed −60.40 M USD of net income which accounts for −18.38% change. Track more Rackspace Technology, Inc. financial stats to get the full picture.
No, RXT doesn't pay any dividends to its shareholders. But don't worry, we've prepared a list of high-dividend stocks for you.
As of Jul 20, 2025, the company has 5.1 K employees. See our rating of the largest employees — is Rackspace Technology, Inc. on this list?
EBITDA measures a company's operating performance, its growth signifies an improvement in the efficiency of a company. Rackspace Technology, Inc. EBITDA is 247.80 M USD, and current EBITDA margin is 9.04%. See more stats in Rackspace Technology, Inc. financial statements.
Like other stocks, RXT shares are traded on stock exchanges, e.g. Nasdaq, Nyse, Euronext, and the easiest way to buy them is through an online stock broker. To do this, you need to open an account and follow a broker's procedures, then start trading. You can trade Rackspace Technology, Inc. stock right from TradingView charts — choose your broker and connect to your account.
Investing in stocks requires a comprehensive research: you should carefully study all the available data, e.g. company's financials, related news, and its technical analysis. So Rackspace Technology, Inc. technincal analysis shows the buy rating today, and its 1 week rating is neutral. Since market conditions are prone to changes, it's worth looking a bit further into the future — according to the 1 month rating Rackspace Technology, Inc. stock shows the sell signal. See more of Rackspace Technology, Inc. technicals for a more comprehensive analysis.
If you're still not sure, try looking for inspiration in our curated watchlists.
If you're still not sure, try looking for inspiration in our curated watchlists.