Stock Of The Day / 03.25.25 / SAVA03.25.2025 / NASDAQ:SAVA #SAVA
Fundamentals. Closing the development of a drug for the treatment of Alzheimer's after another unsuccessful trial.
Technical analysis.
Daily chart: 4-month sideways movement after a downtrend. We makr the low of the sideways movement - 2.23
Premarket: Gap Down on moderate volume.
Trading session: There is a struggle for the level of 2.23. in the premarket and after the opening of the trading session. The price gets into a narrow trading range below the level of 2.23 after 2 unsuccessful attempts to hold above the level. We are considering a short trade if the level is held.
Trading scenario: #rebound from the level of 2.23
Entry: 2.18 when exit down from the trading range below the level
Stop: 2.24, we hide it behind the level
Exit: Close part of the position near the premarket low of 2.01. Close the rest of the position at 1.87 when volumes increase and a reversal candlestick pattern appears.
Risk Rewards: 1/4
P.S. In order to understand the idea of the Stock Of The Day analysis, please read the following information .
SAVA trade ideas

Wyckoff Analysis of SAVA This is an idea of a possible Wyckoff analysis of the price action of Cassava Sciences

SAVA going up?If it breaks the red monthly resistance line, we can see this touch $21.72 and maybe $25.48 by August. If we don't break the red resistance line it will retrace back to $14.16 area.

$SAVA Cassava Sciences Inc Long term PT 145 and higherNASDAQ:SAVA Cassava Sciences Inc
Long term PT 145 and higher
Cassava Sciences, Inc., a clinical stage biotechnology company, develops drugs for neurodegenerative diseases. Its lead therapeutic product candidate is simufilam, a small molecule drug, which is completed Phase 2b clinical trial; and investigational diagnostic product candidate is SavaDx, a blood-based biomarker/diagnostic to detect Alzheimer's disease. The company was formerly known as Pain Therapeutics, Inc. and changed its name to Cassava Sciences, Inc. in March 2019. The company was incorporated in 1998 and is based in Austin, Texas.

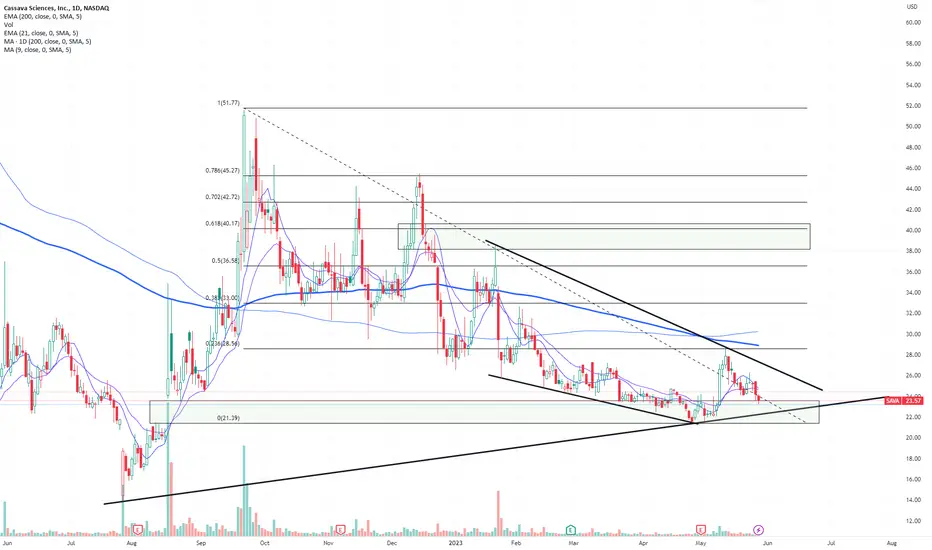
SAVA - Coiling for a big move
Held a multi year support and now basing at a critical level. 22 is likely to be pivot in new few days. Above price can hit 29 and pull back before resuming its journey to 49.
If 22 is lost, 19 has some support, but then base becomes thin for a big rally.
Long via commons at 21.5

Almost time?Just stumbled on this chart earlier when searching for something else... No idea about the company, went to the website real quick something Alzheimer's blah blah blah... look i don't care, technically it looks cool. If we dip down to the support its a good risk/reward with a stop loss directly below it...

SAVA - SHOULD IT RESPECT THE DEMAND ZONE ?I believe it filled the previous AUG 22 spike and created solid demand zone. It is currently closing just above it. In my watchlist for coming weeks and see if it reaches low of the demand zone and then evaluate/predict the next move the next move either to test the trendline line or break it down to lower. Will update later this week.
please share your thoughts.

Falling wedge pattern on SAVA A falling wedge pattern seems to be forming the daily chart. Waiting for confirmation for entry.

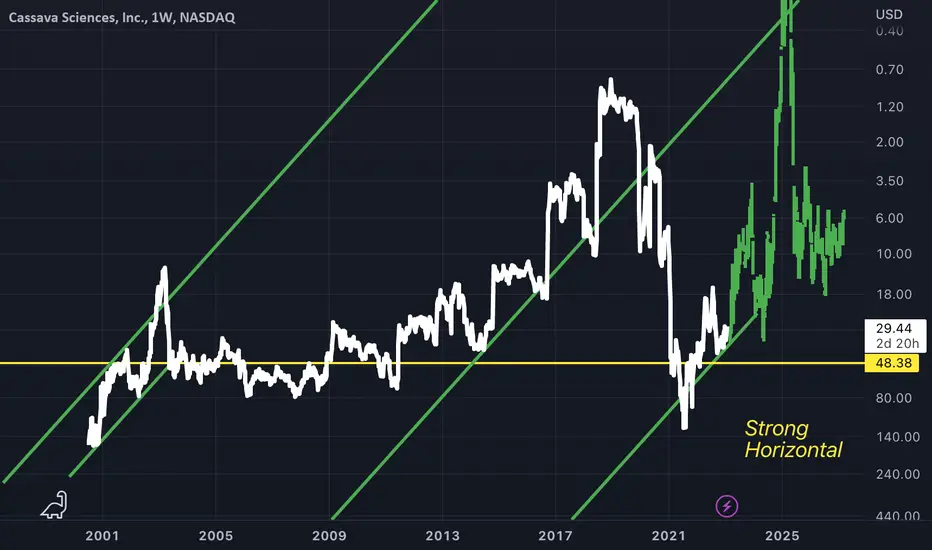
SAVA - Double BottomSlanted Double Bottom
This can be also observed earlier in prices history, again along the strong horizontal in yellow which is the most important take away from this chart
Bars pattern placed in green is just an example of how price could recover
Bullish above the horizontal
Sava Made a YouTube video on this yeateday
Came to conclusion of a potential sick trade
If we can start holding 35.50 as support (best option could be a breakout of 36.55 )
We have huge support at 33$ and 32.45. Anything below 32.45 could cancel the bullish veiw
Looks to be a symtrical triangle with the downtrendinf upper reistance lining up with all of the highs along the downtrend. This is making a big fallinfnwedge potentially and we are also sitting at the weekly 21ema at 35.50 so the choice for bulls and the bears is, are we just rallying to the 21 weekly for a monster rejection, or are we going to pop up through this and rocket?
Biggest next reistance above for me is 43$ even. This sets us up for a 18% gain potential from a 36.50 entry up to 43$. And a 30% upside gain from a 33$ entry. Risking above 2% down to 33 or 32.45
Risk to reward seems good just the entry level will be hard to get in as we are at a very clear reistance
No daily candle body has closed above 35.50 yet so it gives us a VERY clear level!
Take your bets, use your risk! I’ll be watching today and potentially taking a trade but patience will be huge in this! Remebe it has popped up above 35.50 just hasn’t ended the day above and opens the following day above so we have to keep that in mind!
Good luck!!

SAVA to 25 then maybe 14SAVA is forming a flat bottom wedge. Right now, its closer to resistance than to support (which is around 14 dollars). We should see it at 14 by (most likely) mid January.
We may see a short bounce off 200 EMA , which is around 28 dollars

Swing trading on SAVA - 17-10-2022Hello everyone, 🌟
Here again Romluck with a new trading idea,
The trading ideas I find are after searching and investing time.
Thanks for the like and comment.
"Cassava Sciences" :
NASDAQ:SAVA
Market Cap 1.55B
Short Float 28.49%⛔️
Target Price 50$💰
What i see :👀
🔆triggering a possible buy near $40.28.
🔅place to put a stop loss is, near $32.98.
🔆Based on the entry and stop-loss, the estimated risk for the trade is $7.3 per share ($40.28 - $32.98).
⚠️__🚧___🚧___🚧__🚧___🚧__🚧_🚧__🚧__🚧__🚧__🚧_🚧__🚧__🚧_🚧__🚧_⚠️
There is no recommendation for buying or selling or any action in the stock, I am not an investment advisor and publish this article as a hobby only.
Everyone has to perform risk management on their own or contact an investment advisor with a license, I don't have one.
Investing in the stock market involves risking your money!⛔️
have fun

Cassava Rockets After SEC Reportedly Clears It Of TamperingSAVA:NASDAQ is one of those stocks that can get super spikey on news and after a 10 month investigation the SEC has apparently cleared them of any wrongdoing after having previously accused the company of manipulating research results of its experimental Alzheimers Disease drug.
Feels overbought at the moment looking at the RSI, but could be one to watch.

Last chance for SAVA Bulls to get outI believe SAVA won't go back to ATH and likely go $50 $60 max and come down to a few dollars.
This is what I see it. Hope it helps.

Buying $SAVA now @ $23Wouldn't be surprised to see a drop to $21 but I don't want to miss this boat. Fibonacci's extension pressed against the trend line. If this extension does not hold & the trend line rejects, will be looking to add at $11 and then $3.
*Not trading advice

SAVA to 26 then to 32?Sava will hit the support at around 26 or 27 in a few days and if it doesn't go below the support then it has a chance to move up to 32

SAVA Reversal Zone we broke our ascending bearish line on the daily chart , which show some strong buying pressure happing , we will confirm the continuation for the bull run if we hold above our current support above the 24$, and break our first resistant above the 28$, and 32$ is will be the breakout zone to the bullish trend .
if we didn't hold the 24$ support , the next dip will be above the 12$.

$SAVA | Bearish scenario becomes more likelySince last week the scientific data of cassava is under scrutiny.
For more details just read the following blog post: scienceintegritydigest.com

SAVA ~ Short squeeze candidateA week from now is $SAVA earnings.
w/ a 31.5% short float and big mover/common daytrading stock
could be primed for a squeeze prior to earnings over next few days
keep an eye on intraday volume/scaling into call options, any technical break could send it 30-50%

Swing calls for squeeze up - short term tradeSome options activity has been noted today with IV increasing. There is a bit of short interest on this stock. RSI and stochastic need to move up and this recent dip has consolidated and may lead to a quick bounce.
I bought a few weekly 20 calls with stock under 20. Even a short term rally to the daily 20MA will multiply the options nicely.

Cassava Sciences losing momentum. SAVAWe are not in the business of getting every prediction right, no one ever does and that is not the aim of the game. The Fibonacci targets are highlighted in green with invalidation in red. Fibonacci goals, it is prudent to suggest, are nothing more than mere fractally evident and therefore statistically likely levels that the market will go to. Having said that, the market will always do what it wants and always has a mind of its own. Therefore, none of this is financial advice, so do your own research and rely only on your own analysis. Trading is a true one man sport. Good luck out there and stay safe

Sava Ready to Plunge? Cassava Sciences
Short Term - We look to Sell at 32.45 (stop at 36.81)
We look to sell rallies. Trading volume is increasing. Previous support, now becomes resistance at 32.00. We can see no technical reason for a change of trend. The bias is still for lower levels and we look for any gains to be limited.
Our profit targets will be 12.45 and 7.56
Resistance: 32.00 / 40.00 / 60.00
Support: 23.00 / 11.00 / 5.00
Disclaimer – Saxo Bank Group. Please be reminded – you alone are responsible for your trading – both gains and losses. There is a very high degree of risk involved in trading. The technical analysis, like any and all indicators, strategies, columns, articles and other features accessible on/though this site (including those from Signal Centre) are for informational purposes only and should not be construed as investment advice by you. Such technical analysis are believed to be obtained from sources believed to be reliable, but not warrant their respective completeness or accuracy, or warrant any results from the use of the information. Your use of the technical analysis, as would also your use of any and all mentioned indicators, strategies, columns, articles and all other features, is entirely at your own risk and it is your sole responsibility to evaluate the accuracy, completeness and usefulness (including suitability) of the information. You should assess the risk of any trade with your financial adviser and make your own independent decision(s) regarding any tradable products which may be the subject matter of the technical analysis or any of the said indicators, strategies, columns, articles and all other features.
Please also be reminded that if despite the above, any of the said technical analysis (or any of the said indicators, strategies, columns, articles and other features accessible on/through this site) is found to be advisory or a recommendation; and not merely informational in nature, the same is in any event provided with the intention of being for general circulation and availability only. As such it is not intended to and does not form part of any offer or recommendation directed at you specifically, or have any regard to the investment objectives, financial situation or needs of yourself or any other specific person. Before committing to a trade or investment therefore, please seek advice from a financial or other professional adviser regarding the suitability of the product for you and (where available) read the relevant product offer/description documents, including the risk disclosures. If you do not wish to seek such financial advice, please still exercise your mind and consider carefully whether the product is suitable for you because you alone remain responsible for your trading – both gains and losses.
