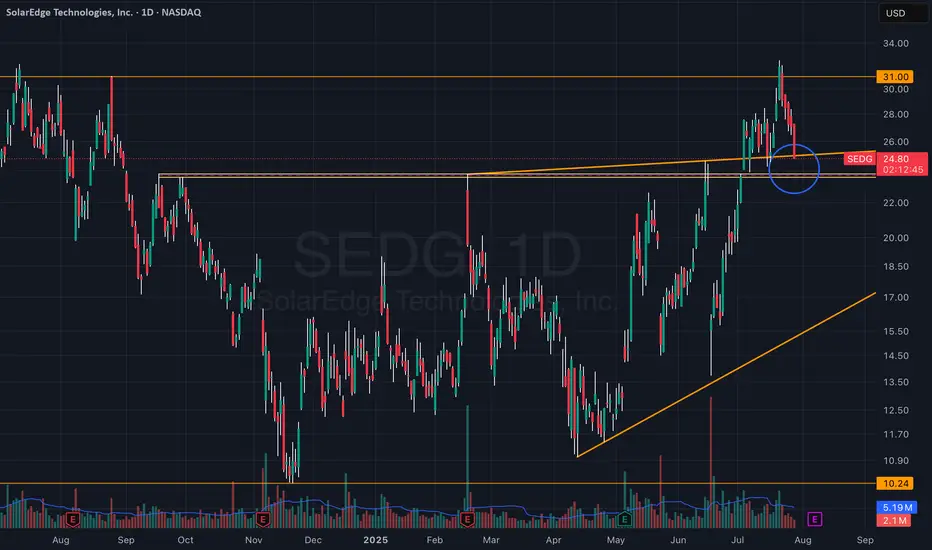
Watching the Retest — $23.5 Target Still ValidStructure remains intact.
Still tracking price action toward the $23.5 zone.
Currently in a retest — stay tuned.
SEDG trade ideas
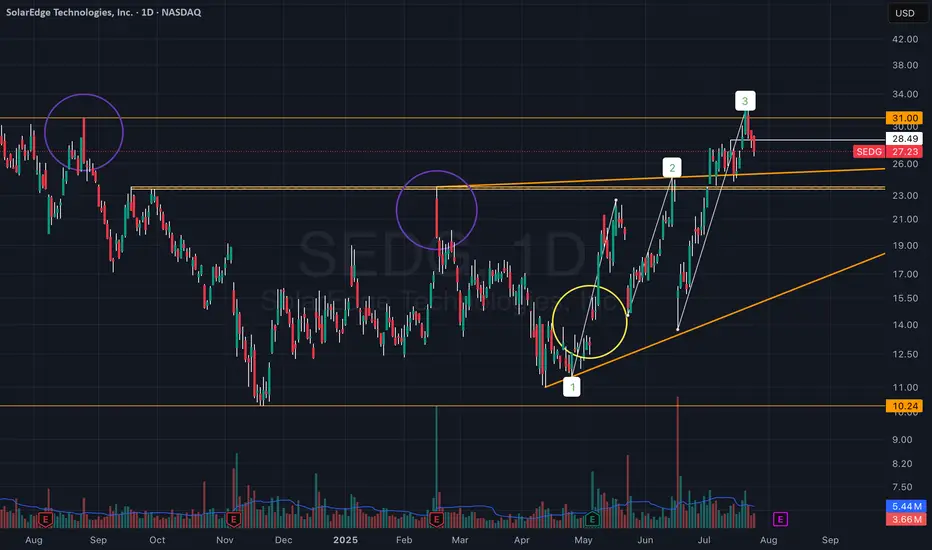
Are We Witnessing a Trend Reversal in SEDG?Something I’ve been watching closely these past few days — SEDG (SolarEdge):
There’s a setup unfolding that I think could benefit from a few more eyes on it:
• The two purple circles mark large vector candles that initiated sharp downward moves.
• The yellow circle highlights the quarterly earnings release, which triggered a strong upward move toward the $20–24 zone — the area of the first vector candle.
These vector candles reflect strong institutional activity that clearly impacted price movement.
A breakout above these zones could signal a meaningful trend reversal forming in the stock.
Price was rejected twice from this area with strong dips, but on the third attempt, it broke through, reaching the next vector candle zone around $26–31.
Now, price is approaching this upper zone with strong momentum following the breakout.
After reviewing the recent earnings report, I noticed a clear recovery and a significant upward revision in guidance, suggesting the company may be shifting direction.
Whether this holds is uncertain — but price action suggests the market is pricing in real change.
We recently printed a high of $32.45, above the $31 vector zone — a notable sign of strength.
At the moment, we appear to be pulling back into support, and structure remains intact.
Yes, there’s clearly a strong battle happening now — but I’m convinced the momentum is with the bulls.
It feels like someone already knows what’s coming in the next earnings release, or at least senses a shift in the company’s trajectory.
Everything seems to be building toward the next earnings report, expected early August.
SolarI randomly scrolled through the list of stock selections here at Tradingview and lo' and behold I found a gem. This gem was buried as if by a pirate and I have unearthed it. Just look at it! Now it can function as it was made to. A proper find indeed. Stay tuned!
Solaredge!! Ready for a rebound?Solar stocks have taken quite a hit. There are several reasons for that, the biggest is high interest rates. Solar companies (installers) often sell solar by having the end-customer finance the up front cost of the system. When interest rates sky-rocketed post-covid, that made it a lot harder to sell solar for many solar companies, the ones who built their entire business model around financed solar. Several solar companies went belly up who owed Solaredge a lot of money. This pushed the stock down even further.
Solaredge is #1 or #2 in many market segments GLOBALLY. They make a good product and are constantly improving it.
If the US removes the tax credit for residential solar, which it looks like it will, the stock will take another tumble but I do not expect it'll ever go below $16/share again.
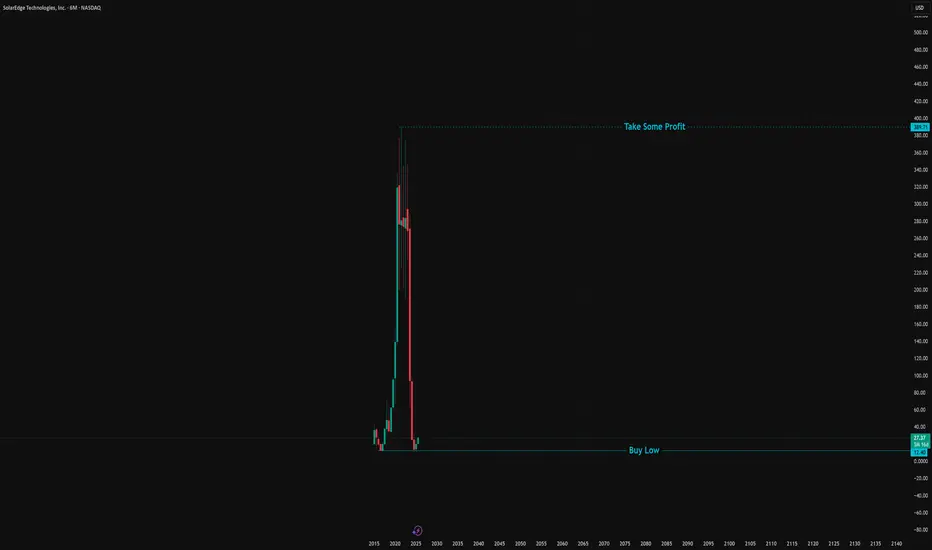
My best guess would be that the stock is strong the rest of 2025, while there's a huge rush the get as much residential solar installed as possible before the U.S. residential tax credit (25D) expires, then 2026 will be a slow year, then democrats take over Congress and re-enact the solar tax credit which would send the stock back into the $300/share range. We'll see :)

Are you ready for a short squeeze?39.47% short interest while 98.8% of shares held by institutions sounds like pure madness of the short sellers when the stock is down 97%.
RenTech (The Famous Quantitative Hedge Fund by Jim Simons) increased its position in the last F13 by 79%.
I opened my position at 10.76 and closed 47% at 23! I have free exposure to a potential squeeze!


$SEDG BEATS + and No Worries! Confessions from the DeskConfessions from the Desk: 10X, Black Coffee, and No Worries
SolarEdge is up 20%, and my Feb 21, 2025, $20 strike call has officially 10X’d. That’s right—after weeks of my portfolio looking like a crime scene, I’ve finally hit a clean, beautiful, 10X multiplier.
And today? I’m sipping my black coffee like a hedge fund manager who actually knows what they’re doing. Not even the endless tariff talk, geopolitical panic, or Fed fearmongering can shake me today. Let them try—I’ll just take another sip.
Now, let’s be real. Am I suddenly a genius? No. Did I see this coming? Also no. But I’m here, and I’m winning. And in this market, that’s all that matters.
So cheers to today. The market gods have finally smiled upon me.

SEDG SolarEdge Technologies Options Ahead of EarningsAnalyzing the options chain and the chart patterns of DKNG DraftKings prior to the earnings report this week,
I would consider purchasing the 16usd strike price Calls with
an expiration date of 2025-2-28,
for a premium of approximately $1.76.
If these options prove to be profitable prior to the earnings release, I would sell at least half of them.

Cannot unsee this movemajor potential, caravana like chart. extreme divergence on the daily and weekly
buying now and will DCA down to the following levels 9.75 and 4$

SEDG will it mimic caravana move !!??similarities in both charts, heavily beaten down and building large weekly divergence on the RSI.
could still go lower from here but it should represent a buying opportunity, the upside is huge

WHAT DO YOU SEE?a FLAG?
or
A Cup?
or
Something else?
What if tell you this ticker has 33% short interest and 98.9% institutional ownership?

SEDGE Falling Wedge - Seems bullishThe name is setting up for a breakout.
I buy now a little bit.
I'll add if we touch the lower line.
I will add at the confirmed breakout.
Lets see :)

SEDG Possible Play's Again my cus trades stocks so I figured I would post what I charted up for him. When looking at possible play's you will need to go down to a 2min time frame to get your entries. With the gaps in these stocks it can be difficult to find entries with so much missing data. maybe I don't pay enough to see it . I cannot post lower time frames and zones but set up 30min wick highs / lows -zones 3 candles back and you will see the support and resistance

We will wait to June or July for SEDG!!!1) I drew Resistance line on RSI Indicator.
2) I drew Resistance line on Momentum Indicator.
3) I drew Resistance line on CCI Indicator.
4) I drew Resistance line on MACD Indicator.

SEDG Solaredge - More losses ahead?Solaredge Chart Analysis
The stock is in a clear downtrend since February
with a Significant resistance level at around $32.11
The Minor support seems at around $17.12
Increased volume during price drops indicates strong selling pressure and
Prices below the EMA are clues for bearish momentum
Key Points for a Trade
Entry: Consider waiting for a break below support or a pullback at resistance.
Stop-Loss: Set slightly above recent swing high ($24) to manage risk.
In case of pullback look for Stops at around $32.90
Trend continuation: Be cautious at EMA crossover or strong volume spikes, which could indicate a trend reversal.
Additional Clues:
Todays Put Option Volume increased 1,4 times of what was expected indicating bearish flow

Breakout on the weekly?Good volume on what seems to be the bottom. Might be a good longer term hold.

Solaredge should have bottomed out now .......... !?!NASDAQ:SEDG
I think after 95% down and ABC Correction - Also all sub Waves look to be finished - We could maybe now see the low in many Solar related stocks like Solaredge, Enphase, Jinko, Trina etc.
Two Days ago we had a Hammer Daily and could see that weekly we get also a Hammer and daily we had just 3 day formation of Morning Star .....
www.tradingview.com

SEDG Currently Entering Buy ZoneThis is where I start accumulating SEDG again after being stopped out a few months back. Risk/Reward here is above 3. I have resting orders scattered across the green zone with a stop at the swing low.

SEDG due for a big bounce?The recent bullish price action in solar names like ENPH and FLSR has me looking at SEDG. I think we can easily get a push up to the $80-90 zone.

OversoldWe are still falling but the Donchian Channel has turned already and the MAs are beginning to hint for a light oversold condition already. As we have fallen so deeply for over a year now the risk for further deep declines are smaller now.

SEDG will come back soonSEDG will come back soon:
-Successful shakeout.
-Wedge pattern.
-Voume confirm.

SEDG - BullishFor a while now SEDG has been consolidating. Mid March, the price tried to take the lows out however it failed. EMAs crossing now and momentum picking up to the upside.
Risk responsibly. Good luck

ResistanceAfter the short from March 7th until March 20th we saw a rebounce. It has reached more than 50 % retracement now and I think that it is worth to play the downside again.
