SEDG trade ideas

SEDG 🌦➡️Pattern recognized:
Running flat
➡️Hypothesis:
Bullish
➡️Inter-market analysis:
➡️Conclusion:
LDC fractal on lower time frame. Buy calls expiration minimum 3 months.
***This does not constitute financial advice.***
If you like what you see why not support us?
👇

SEDG🌦I believe now would be great time to buy calls for SEDG leading up to earnings. Fractal formed on the lower time frame. This is my signal to start buying to open calls. For those of you who recently followed me, I depend on fractals as a signal for entry. I use a method call Modified Elliott wave analysis.
Inter-market analysis 👇

SEDG 08-03-2021 LongAsset and Time frame -4H,SEDG
Entry Price -253.94
Exit(Stop Loss) - 232.89
Exit(Take Profit) -315
Technical Analysis -Price is moving inside a bearish channel and reached the bottom of the channel,also the price reacted to the -27.2 Fibonacci level with a good bullish candle, this will be a short moved since the market is really unpredictable at these times, I entered the position risking 0.75% instead of 1%, stay safe :)
Good luck,
I would like to hear your opinions and feedback, with thanks, Aviran

GartleyPossible Targets 2: 466 to 530.
Targets 2 are long term targets and perhaps a good idea to focus on targets 1 (o:
The Gartley is a common pattern in the markets. B is at the .610 retracement of the XA leg. Sedge is a few dollars short of this but the landing pad, D, was right on target at the .786 fib level. The Gartley pattern, a harmonic pattern, is a retracement and continuation pattern that occurs when a trend temporarily reverses direction before continuing on its original course. There is also a bearish version which would look like a crooked W and starts with a leg down verses a leg up (XA).
This is also an AB = CD pattern and if you think you are looking at a Gartley, draw your AB leg, then using the magnet, move it to start right below C. There are other harmonic patterns that can follow close to the same pull back of XA on the AB leg, so you do have to wait for the landing pad to know for sure (and nothing is for sure in the market) LOL. There is often volatility when a security is trying to find the point of completion. But you can start trying to figure out which harmonic pattern you are looking at on the AB leg and where it completes at. If C is above A, you do not have a Gartley, but it may be a Cypher or a Shark pattern.
These patterns help you get in at a point that is close to where you need to be. This pattern often appears to be a triple or double top of some type, and in reality, I guess it is. Many get out of the trade when C does not make it to A..so the selling exacerbates.
Any pattern can fail )o:
The pattern is often referred to as Gartley222 because H. M. Gartley first described it on page 222 of his 1935 book Profits In The Stock Market.
Not a recommendation
Volatile stock. If you do not like the long entry one day, try waiting for the next (o:

SEDG FORECAST - SOLAREDGE TECH INCLongs look good under green line, stops under white, targets above green. THIS IS NOT FINANCIAL ADVICE, THIS IS RECORD KEEPING ONLY. DO NOT BLINDLY FOLLOW THIS TRADE.


SEDG 24-02-2021 LongAsset and Time frame -SEDG,4H,Daily
Entry Price -301.79
Exit(Stop Loss) -282.64
Exit(Take Profit) -364.96
Technical Analysis -Price has bounced from the daily confirmed channel and the 100 MA and on the 4H chart a massive hammer pattern but without confirmation, the market sentiment at the moment is bearish for almost all of the tech sector, would recommend entering with a smaller position.
Good luck,
I would like to hear your opinions and feedback, with thanks, Aviran


ABC BullishNo bearish rising wedges noted in yearly chart which is unusual for a stock that has come this far up in price in this market.
SEDG is forming a HRZ and support may be found under that zone, but this is a volatile stock and if you do not like price one day, then wait until the next day (o: Loose stop is a good idea if you plan to hang with this one. I buy this one on pullbacks and add to my position.
Long entry level is a break of the BC line with a confirmed uptrend or a bullish candle formation. Long entry level can be subjective and should be above immediate R.
Patterns morph over time and patterns can fail. The only thing that never changes is change (o:
Not a recommendation.

$SEDG looks good to break out after rebuildThe stock has seen positive momentum over past 2 days and looks set to break out. Once $332 is taken out with strong volume, look for it to retest its ATH


important level test!Solaredge is going to be tested tomorrow on both it's trend line and it's fib retracement important level,
the solar sector is cooler than it was last month, but we definitely can see a major upmove in the stock.
what do you guys think? NASDAQ:SEDG

IdeaHI Just wondering if i did this right, I figured the support on $SEDG as it tested three times and bought the share at that point. Did i do that right?

SEDG LongRiding up-channel. Retracement down to .318 and just closed above .618 fib. Green energy sector looks like its cooled down and ready to run again.

My First Chart Analysis. Bullish GREEN Stock? Advice Welcome...Does this chart indicate a potential period of consolidation before strong bullish momentum?
This is my first attempt at "detailed" analysis of a chart form my last few weeks of learning. Please be mindful of this. 😬
From the notes on my chart my analysis is that there may be a period of consolidation that might give a buy point of SEDG around 311.
Notes include positive indications.


Cup and HandleSEDG has reached 335.8 and pulled back close to long entry level..
Solar seems to alternate days..feels like one day they all go up and the next day they all pull back ..
Support can be found under HL/Handle low and MC/Mid cup..
Cup low is 190.10 so this is a fairly deep cup..
Targets are calculated using cup depth and added to the long entry level using fib levels
Not a recommendation
Known to be volatile and if you do not like the price today, then just wait until tomorrow (o:
No rising wedges noted in yearly chart. OBV and NV are high which shows interest. Short interest is 5.94% approximate/depending on where you look

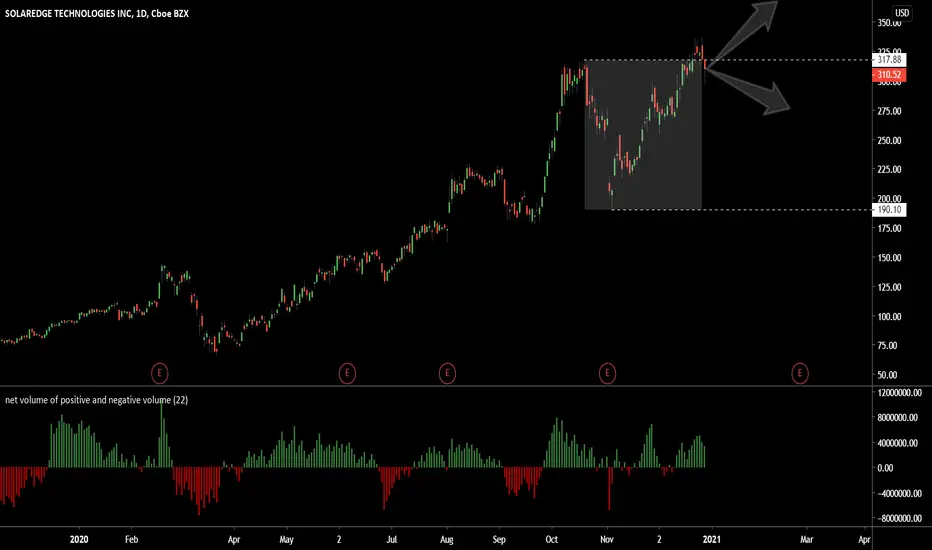
Right on the edgeSedg has had a great run and has been recently testing the top end of the range. Range highs and lows are always potential phase transition points. We will either see a reversal back into the range or a further breakout. Given the stocks recent big move and the overall sentiment in the solar space I am less confident about the breakout but I am still on the sidelines for now waiting for a more definitive close in either direction.
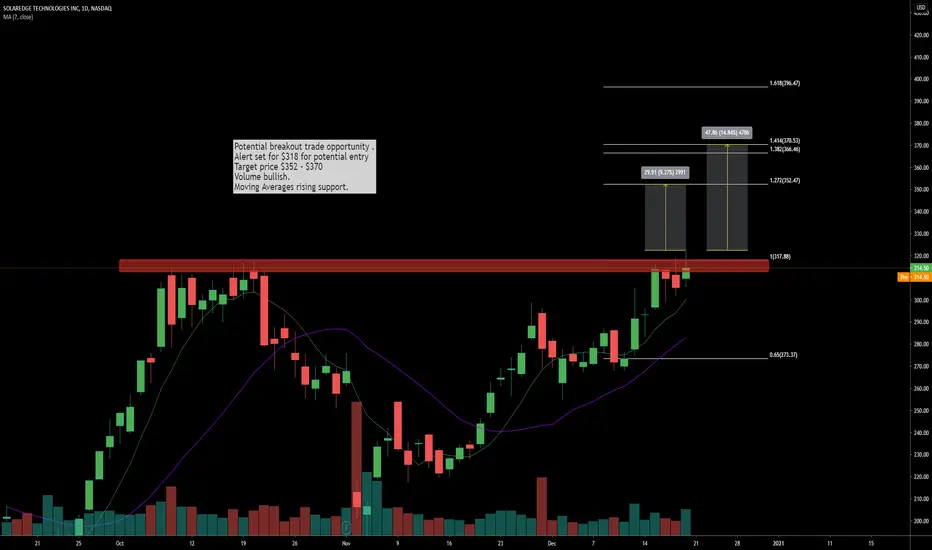
$SEDG SolarEdge Tech Breakout Trade setup
Potential breakout trade opportunity .
Alert set for $318 for potential entry
Target price $352 - $370
Volume bullish.
Moving Averages rising support.
SEDG - December 20, 2020SolarEdge Technologies Inc. provides solar power optimization and photovoltaic monitoring solutions worldwide. Last week's uptrend was driven by improving wall street sentiment, evident through price target upgrades from numerous institutions, including from $ 239-315 at JP Morgan. Solar stocks across the board have begun to benefit from the increased emphasis on a solar future from president-elect Biden and his incoming administration. Look for this stock to build off it's recent momentum with potential for short term upside.

SEDG over 294.00Whether or not we get a rotation back into solar, this chart looks set up for a breakout over this level. Looking at this on the hourly, there was a larger move that was given back that you can also see on the daily upper shadow. As this has found support at the fib, I think this hints at future movement.

