$SFM : Stock with no Tariff exposure and good momentumNASDAQ:SFM : We are revising this stock one more time in our blog series. Sprout Farmers Market NASDAQ:SFM is a retailer which sell high quality food with higher margin in good localities and the best part is the products are locally produced and sourced. This makes it immune to the tariff discussions ongoing in the market. Hence, we have seen relative strength in the $SFM. There are very few stocks in S&P 500 which are at or above the ATH. NASDAQ:SFM touched its ATH of 178 $ on 28th April amidst the tariff discussion. Currently @ 163 $ SFM has a RSI of 60 which is not in overbought territory.
In the chart below we plot the upward slopping regression channel and we see that the stock is currently sitting at the mid-point of this cannel and the 20 Day SMA is above the 50 Day, 100 Day and 200 Day SMA indicating positive momentum in the stock. The lower bound of the parallel channel is always above the 200 Day SMA indicating strong institutional long term holding capability. We like these kind of stocks which have great technical and good fundamentals with strong institutional holdings.
Verdict : Buy NASDAQ:SFM @ 150 $ and DCA @ 160 $. Year end target 200 $
SFM trade ideas

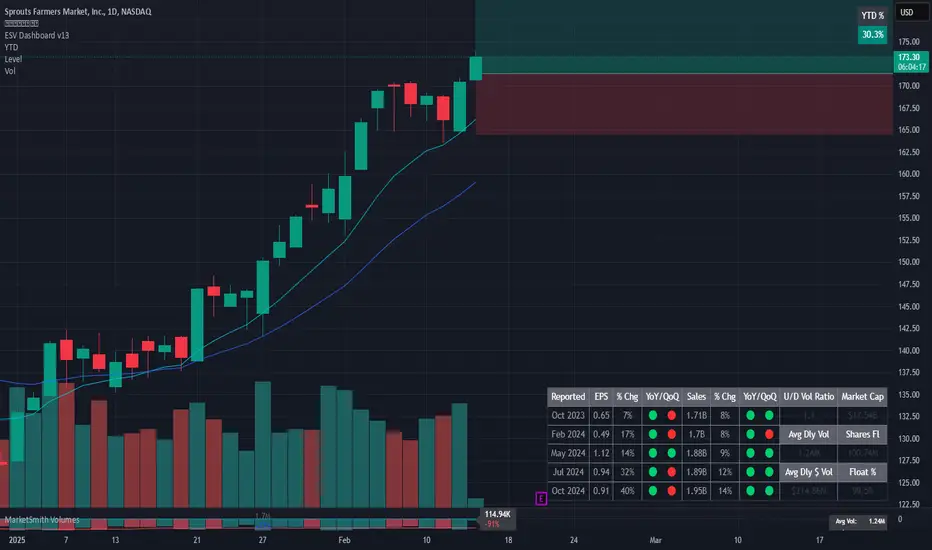
[bear] SFM short trade- XLP sector overextended
- SFM overextended
- Decreasing green volume
- Multiple inverted hammer high vol green daily candles
- Possibly the right shoulder
- Any close above 163 is worthy of looking twice to get out
- SL: 170.
- TP1: 135-136.
- TP2: 83-85.

Technicals on SFM if you are planning to short.SFM broke its uptrend line from July 2024 during the week of March 3, 2025. Over the last three weeks, price climbed back toward that broken trendline, testing the underside of the and signaling resistance and potential confirmation of the breakdown.
This type of retest and rejection setup is often a classic reversal signal. On the weekly chart, a potential head and shoulders pattern is taking shape, suggesting price may roll over further in the coming weeks.
🔴 Bearish Scenario (Primary Bias)
SFM is rolling over after rejecting the underside of the broken uptrend line.
Potential entry point: break of 10/20EMA on Daily
If that breaks, price could pause around 139, then drop into the 120–130 area, a broader demand zone with historical support.
The move may find a floor around 122, where the rising 200-day SMA and a second uptrend line from January 2024 converge.
🎯 Bearish Targets:
139 → 130 → 122
And just for objectivity:
🟢 Bullish Scenario (Reclaim Required)
Bulls would need to reclaim the broken July 2024 uptrend line.
That would require a move above ~153–155, clearing both the trendline and current resistance levels.
If reclaimed, it may open the door to retesting prior highs near 178.
🎯 Bullish Targets:
154 → 164 → 178
⚪️ Neutral Scenario
Price remains caught between 140 and 155, grinding sideways.
Multiple EMAs and broken trendlines overhead could act as resistance, while the daily 10/20EMAs and minor horizontal supports provide footing below.
This could be a consolidation phase before a more decisive move unfolds.

SFM - LONGSFM - Bought today at close of second 5 min candle
Meets all 6 trade requirements .
Will update trade management on comments ....
Bought on 5 min with goal of transferring to daily .
$SFM outperforms the Consumer Stables ETF $XLPNASDAQ:SFM outperformed the Consumer Discretionary select sector SPDR fund $XLP. Sprout Farmers ( NASDAQ:SFM ) has been a great momentum stock within the consumer staples. It has outperformed all the stocks with the of the AMEX:XLP in the last 5 Year period. It has also outperformed other momentum ETFS like Technology sector ETF $XLK. In this Chart we plot SFM against XLP and we clearly see that when consumer staples ETF AMEX:XLP is struggling NASDAQ:SFM is making new highs. NASDAQ:SFM chart shows a bullish golden cross when 20-Day SMA is above 50-Day, 100-Day and 200-Day SMA.

SFM: A great entry to a 2024 big winnerUnless the market continues to behave weirdly, this is my top pick for tomorrow.
Low risk entry after amazing support of earnings gap and AVWAP crossing. Bounce off 21d EMA (white cross below last candle) and bullish momentum confirmed (green diamond).
Options positioning supporting the current set-up. What's not to love about this one?
Well, market can destroy any beautiful thing, always, without notice.

SFM to $142My trading plan is very simple.
I buy or sell when price tags the top or bottom of parallel channels.
I confirm when price hits Fibonacci levels.
So...
Here's why I'm picking this symbol to do the thing.
Price at bottom of channels (period 100 52 39 & 26)
Stochastic Momentum Index (SMI) at oversold level
VBSM is negative and at bottom of Bollinger Band
Entry at $100131.5
Target is $142 or channel top


Sprouts Farmers Market, Inc. (SFM) trade ideaSFM is forming an ascending triangle pattern, indicating a potential bullish continuation. The price is currently consolidating around 101.68, just below the resistance level at 104.5, which is the key breakout point. The ascending triangle suggests increasing buying pressure as higher lows form, building up momentum for a possible upward move.
Breakout Watch:
The stock is approaching a critical breakout point at 104.5. The recommended trading strategy includes exiting 25% at T1 (108.16) with the stop loss moved to breakeven, exiting 50% at T2 (116.18) with the stop loss moved to T1, and exiting the remaining 25% at T3 (122.50). The stop loss is initially set at 93.75 to limit potential downside.
It is important to monitor the volume closely for confirmation of a breakout above 104.5, as increased volume could signify a stronger breakout move.

Buy Sprouts Farmers MarketShort Term Trading Advice by Naranj Capital
Buy Sprouts Farmers Market
● Buy Range- 78.5 - 80
● Target- 84 - 85
● StopLoss- 75.8
● Potential Return- 5-6%
● Duration- 12-14 Trading Days

Sprouts To Do A Third Touch At Strong Support NASDAQ:SFM is currently trading in a parallel channel and looks like it will trend down to attempt to retest the support at about $60.70 for a third touch.
Thoughts?

Sprouts ($SFM) Shares Spiked 10.92% on Strong Q4 PerformanceSprouts Farmers Market (NASDAQ: NASDAQ:SFM ) has caught the market's attention with a remarkable 10.92% surge in its stock price following the release of its fourth-quarter results. Despite revenue aligning with expectations, the company's earnings per share (EPS) surpassed analysts' forecasts, driven by robust same-store sales growth and controlled new store openings. This performance signals a promising trajectory for the grocery store chain, reflecting its ability to navigate challenges and capitalize on opportunities in the retail sector.
Solid Financial Performance:
Sprouts Farmers ( NASDAQ:SFM ) Market's Q4 results underscore its resilience and strategic prowess. The company's higher profitability, fueled by better-than-expected same-store sales growth, highlights its operational efficiency and customer appeal. Additionally, the controlled pace of new store openings demonstrates prudent capital management, ensuring sustainable growth while mitigating risks associated with excessive expansion. This balanced approach not only enhances shareholder value but also strengthens Sprouts' position in the competitive landscape.
Market Perception and Shareholder Satisfaction:
Despite its relatively low volatility compared to the market average, Sprouts' stock experienced a notable uptick, signaling investors' positive reception of the latest financial report. While today's surge may not fundamentally alter perceptions of the business, it underscores the market's recognition of Sprouts' solid performance and growth potential. Shareholders can take confidence in the company's consistent value creation, evident in its impressive 18.4% year-to-date increase and substantial long-term returns.
Strategic Outlook and Growth Prospects:
Looking ahead, Sprouts Farmers Market ( NASDAQ:SFM ) remains well-positioned for continued success. Its strong same-store sales growth and optimistic earnings forecast for the full year underscore its resilience amidst evolving market dynamics. With a focus on customer-centric strategies and prudent expansion, Sprouts is poised to capture additional market share and drive sustainable growth in the highly competitive grocery industry. Moreover, its commitment to innovation and sustainability further enhances its appeal to environmentally-conscious consumers, fostering long-term loyalty and brand equity.
Sprouts Farmers Market's ( NASDAQ:SFM ) recent performance exemplifies its commitment to delivering value to shareholders and customers alike. Despite facing challenges inherent in the retail landscape, the company has demonstrated resilience and adaptability, driving sustained growth and market outperformance. As it continues to execute its strategic initiatives and capitalize on emerging opportunities, Sprouts remains a compelling investment opportunity for those seeking exposure to the thriving grocery sector. With a solid track record of success and a promising outlook, Sprouts Farmers Market ( NASDAQ:SFM ) stands poised to deliver continued shareholder value in the years to come.

SFM can't go up foreverChart speaks for itself. On Log scale, this parabola was momentarily lost in June of this year and then recaptured. Could this go higher? For sure. I sold my position and will be looking to buy back shares around the 26-30$ range where the bearish divergence started forming. On the good side of things, this whole setup could become a gigantic cup and handle pattern by next year.
This high growth company has been great on the long side since 2022, but I do believe it's due for a correction.

Potential 24% upside Sold off after ER. I believe that this will close the gap and make it back $31 in 6 weeks.

22/2/2022 NASDAQ (SFM)Buy (Entry Price) within the buy zone area and exit (Stop Loss) below the red line. Can take profit at the suggested Target Price.

SFM long after earnings this weekI've been following this stock way too much. Great fundamentals, growth, leadership, they are buying back stock... but somehow they've broken the $25 support (maybe they ran out of money to buy back?). At least it looks like that to me. No matter how I slice it I'm having trouble making a bullish case in the short term. However I'm still targeting $28 in the near term. This chart shows how I think it could happen.
If you look back at their earnings in February, the short-term traders took the stock down nearly 5% the day after earnings. Combined with IV crush this would have been the perfect time to buy calls. Then reality set in that this company is making a lot of money, they announced buybacks, and the stock took off. I'm hoping the same thing happens again this week.
Assuming it drops to $23, the .786 retrace is right at $28.

SFM LevelsWe close below this range, I exit and reenter lower. We hold this level, we've cleaned out all the sellers and ride it. Enter at own risk. Biased with my sizeable percentage of shares.


$SFM. Not really sold on it. Not sure why I'm posting.It's showing some kind of bull flag/coiled spring, but it's not a fantastic picture. I don't really love it, and I'm heavily questioning everything I'm seeing. I can see why stimulants are so popular in trading/life in general. Without them this task is unenjoyable to the core.
Probably shouldn't post this, but just a little real-life energy comin' at ya. Man was not meant to sit in front of a computer for extended hours. This pressure to perform is just a little too much sometimes.

Cup N Handle - Long - SFMLooking for a pullback on SFM - Buying the breakout
Cup and handle setup with a target of $35.00

Sprouts Farmers MarketsChart pattern: Bull flag
Entry: 27.91$ (this would end the secondary downtrend of the correction)
Stop: 25$
Target: 33$
Stopmanagement: ATR Stops daily chart default settings
Risk:Reward-Ratio: ~ 2:1
Description: The chart is forming a bull flag with a nice corrective pattern (which retraced under the 38 Fibonacci retracement ). Target is the 1:1 Fibonacci extension of the former impuslive move. Also, the decreasing volume during the consolidation confirms the overall bullish sentiment.

Possible long term play with short term correction.The price have reached upper channel line (resistance) and due to market condition can
a) form a handle of a cup and than go higher or
b) break the line (after break retest may happen)
and than long based on measured move
or
the price can't break the resistance and rejection will be a downward move to the bottom line of the channel.
One should notice that on weekly chart RSI is approaching to overbought zone (highlighted green dots).
Not an advice or recommendation, just an observation.
