SMCI: Rejection on the 1W MA50 will be the last buy opportunity.Super Micro Computer has turned overbought on its 1D technical outlook (RSI = 76.279, MACD = 3.600, ADX = 40.488) as a result of the relentless rally of the past 2 weeks but on 1W (RSI = 57.515) it just turned bullish, which is indicative of the long way it has to cover until it makes new ATH again following last year's accounting discrepancies. The price is about to test the 1W MA50 as a Resistance, which under normal circumastances of Bull Cycle, it is a support. A potential rejection there, should provide the last buy opportunity that will test the 1D MA50 as a Support. We remain long on SMCI, next TP = 95.00.
See how our prior idea has worked out:
## If you like our free content follow our profile to get more daily ideas. ##
## Comments and likes are greatly appreciated. ##
SMCI trade ideas

SMCI: Buy ideaBuy idea on SMCI as you can see on the chart because we have the breakout with force the resistance line by a big green candle follow by a large green volume...

I don’t usually short stocks… But SMCI looks like a good bet to see much much lower pricing. I’m not going crazy but I’m planning on starting small short (1-2% of the account) and plan to up it to 3-4 if it looks favorable. I will have lots of time on this as it may take awhile to play out (3-6 months). The levels are clearly marked, red resistance / green support. I will short once momentum show signs of reversing. I will wait for a weekly red candle stick.

Micro Computer 2-17 (scalping + forecast) 🔥 Market Overview:
Trend: Super Micro Computer (SMCI) is in a strong uptrend, recovering from previous lows with high momentum.
Key Levels:
Resistance: $50–$52 (potential breakout zone).
Support: $44–$45 (Supertrend support).
Indicators:
EMA 9: $44.72 (acting as strong support).
EMA 200: $34.74 (long-term bullish signal as price remains above).
Supertrend: $41.64 (trend remains bullish).
MACD: Bullish, confirming continued momentum.
RSI: 77.57 (overbought, but strong momentum remains).
🔥 Scalping Strategy:
🩸 1. Momentum Scalping:
Buy near: $45–$46 on small pullbacks.
Target: $50–$52.
Stop-loss below: $43.
🩸 2. Breakout Scalping:
Long if price breaks above: $50, targeting $55.
Short if price rejects $50, targeting $45.
🩸 3. Range Scalping:
Sell near: $50–$52 resistance.
Target: $45–$43.
Stop-loss: $53 if breakout occurs.
🔥 Mid-Term Trend Forecast (1-3 Weeks):
If SMCI breaks $50, expect a rally toward $55–$60.
A rejection at $50 could lead to a short-term pullback toward $45–$43 before resuming the uptrend.
RSI is overbought, so some profit-taking is likely before the next move.
🔥 News & Market Context:
AI & Data Center Demand: SMCI benefits from strong AI-driven server demand.
Tech Sector Rally: Stock is riding the momentum of high-growth tech plays.
Macroeconomic Factors: Potential rate hikes may slow down speculative growth, but fundamentals remain strong.
🔥 Decision:
🩸 Short-term: Look for a breakout above $50 or a pullback for re-entry near $45.
🩸 Mid-term: Bullish, but extended. Look for consolidation before continuation.
🩸 Ideal Play: Buy on dips or scalp breakouts above $50.
👑 Final Verdict: Super Micro is in a powerful breakout phase, but profit-taking near resistance is possible. Bulls must clear $50 for continuation.
🔥 LucanInvestor's Quote: "Momentum is a weapon—use it wisely, or it turns against you."

Super Micro Computer (SMCI) Shares Surge 13%Super Micro Computer (SMCI) Shares Surge 13%
The Super Micro Computer, Inc. (SMCI) stock chart shows:
→ Friday’s closing price rose over 13% from Thursday’s close;
→ The stock has surged more than 80% from its February low;
→ Friday’s close marked the highest level since late October 2024.
SMCI’s rally comes despite an 11 February quarterly report that missed expectations:
→ EPS: $0.59 vs. expected $0.60;
→ Revenue: $5.65bn vs. expected $5.72bn.
Bullish sentiment is driven by (according to media reports):
→ A forecasted $40bn revenue for FY2026, 70% higher than projected FY2025 revenue;
→ Reports indicate that SMCI shares are unlikely to be delisted from NASDAQ due to financial reporting issues (which we previously discussed when analysing the SMCI stock chart on 3 December);
→ Investor enthusiasm for AI and rapid data centre construction to support it.
Technical Analysis of SMCI Stock
The price has reached the key psychological level of $50 per share:
→ Historical price action at this level has often triggered significant reversals;
→ A bullish cup-and-handle pattern is forming.
A higher second low suggests growing demand strength, potentially leading to a bullish breakout above $50.
SMCI Stock Price Forecast
Analysts remain cautious. According to Yahoo Finance:
→ Only 2 of 6 analysts recommend buying SMCI shares;
→ The 12-month average price target is $47.91.
Trade on TradingView with FXOpen. Consider opening an account and access over 700 markets with tight spreads from 0.0 pips and low commissions from $1.50 per lot.
This article represents the opinion of the Companies operating under the FXOpen brand only. It is not to be construed as an offer, solicitation, or recommendation with respect to products and services provided by the Companies operating under the FXOpen brand, nor is it to be considered financial advice.

$SMCI strong technical position with a bullish trendAs of February 6, 2025, MSCI Inc. (MSCI) is trading at $581.47, experiencing a slight decrease of 0.11% from the previous close.
Technical Analysis:
Over the past year, MSCI's stock has demonstrated a bullish trend, with a 52-week range between $439.95 and $642.45. The stock is currently trading approximately 9.5% below its 52-week high, indicating potential room for upward movement. The Relative Strength Index (RSI) suggests that the stock is neither overbought nor oversold, maintaining a neutral stance. Moving averages, including the 50-day and 200-day, show a positive alignment, reinforcing the bullish outlook.
Fundamental Analysis:
MSCI has reported consistent revenue growth, with a 7.7% increase in operating revenue to $743.5 million in the recent quarter. However, operating expenses also rose by 5.9% to $338.3 million, primarily due to higher compensation and a 5.8% increase in employee headcount. This led to a 24.3% decline in fourth-quarter profit, totaling $305.5 million, or $3.90 per share, down from $403.4 million, or $5.07 per share, the previous year.
Despite the recent decline in profit, MSCI's expansion into ESG (Environmental, Social, and Governance) and climate-related products has been a significant growth driver. The ESG and Climate segment accounted for 11.2% of total revenue in the second quarter of 2024, up from 7.9% three years prior. This growth is attributed to increased demand from investors seeking to assess physical risks associated with climate change.
Potential Partnership with NVIDIA:
While there is no official announcement of a partnership between MSCI and NVIDIA, MSCI has expanded its collaboration with Google Cloud to accelerate the development of generative AI solutions for the investment industry. This partnership aims to leverage AI to help investors identify and manage risks and opportunities more effectively.
Given NVIDIA's leadership in AI technology, a potential future partnership between MSCI and NVIDIA could further enhance MSCI's AI capabilities, leading to increased efficiency and potentially significant revenue growth.
Conclusion:
MSCI Inc. exhibits a strong technical position with a bullish trend supported by favorable moving averages. Fundamentally, the company is expanding its offerings in high-demand areas such as ESG and AI-driven investment tools. The potential for a partnership with a leading AI company like NVIDIA could further bolster MSCI's growth prospects, making it an attractive consideration for investors.

SMCI LowerHi, on the techincal side, SMCI might go up to the EQH of that bearish breaker and continue lower, if it breaks 27$ imbalance then it will move right away.
NFA

SMCI seems nice SMCI seems to have nicely retested the OTE level from the Daily MMBM, so my current target levels are the -2/-2.5 standard deviation levels. The image shows my entry levels and potential target prices.
Let’s also analyze the stock fundamentally— why could it go higher ?
Fidelity, the third-largest asset manager in the world, initiated a new position in Q4 with 9.6 million shares valued at $460 million USD.

SMCI - Climbing out of the GRAVE! 100% UpsideNASDAQ:SMCI
🎯$64 🎯$85 Incoming
WOW, from dead company to short attacks into oblivion this company has clawed back from the grave!
- Inverse H&S
- Fake Out on the S/R Zone
- Green H5 with Bullish Cross
- Volume shelf with GAP
- Up Trending Wr%
- RSI/ STOCH breaking out of downtrend
If I was to enter this trade I would look for an entry at the retest of the Inverse H&S breakout (Blue Circle) while we also create a WCB!
Not financial advice

Long Trade Setup Breakdown for (SMCI) 30Mins
🔹 Asset: Super Micro Computer, Inc. (SMCI)
🔹 Timeframe: 30-Min Chart
🔹 Setup Type: Ascending Wedge Breakout
🚀 Trade Plan (Long Position):
✅ Entry Zone: $47.96 (Breakout Confirmation)
✅ Stop-Loss (SL): $45.35 (Below Support)
🎯 Take Profit Targets (Long Trade):
📌 TP1: $51.05 (First Resistance)
📌 TP2: $54.64 (Extended Bullish Target)
📊 Risk-Reward Ratio Calculation:
📈 Risk (Stop-Loss Distance):
$47.96 - $45.35 = $2.61
📈 Reward to TP1:
$51.05 - $47.96 = $3.09
💰 Risk-Reward Ratio to TP1: 1:1.18
📈 Reward to TP2:
$54.64 - $47.96 = $6.68
💰 Risk-Reward Ratio to TP2: 1:2.56
🔍 Technical Analysis & Strategy:
📌 Breakout Confirmation: Strong buying momentum above $47.96 signals continuation.
📌 Pattern Formation: Ascending wedge breakout, indicating bullish movement.
📊 Key Support & Resistance Levels:
🟢 $45.35 (Strong Support / SL Level)
🟡 $47.96 (Breakout Zone / Entry)
🔴 $51.05 (First Profit Target / Resistance)
🟢 $54.64 (Final Target for Momentum Extension)
🚀 Momentum Shift Expected:
If price sustains above $47.96, it could push towards $51.05 and $54.64.
A high-volume breakout would confirm the strength in trend continuation.
🔥 Trade Execution & Risk Management:
📊 Volume Confirmation: Ensure buying volume remains strong after breakout.
📈 Trailing Stop Strategy: If price reaches TP1 ($51.05), move SL to entry ($47.96) to lock in profits.
💰 Partial Profit Booking Strategy:
✔ Take 50% profits at $51.05, let the rest run to $54.64.
✔ Adjust Stop-Loss to Break-even ($47.96) after TP1 is hit.
⚠️ Fake Breakout Risk:
If price drops below $47.96, be cautious and watch for a retest before re-entering.
🚀 Final Thoughts:
✔ Bullish Setup – If price holds above $47.96, higher targets are expected.
✔ Momentum Shift Possible – Watch for volume confirmation.
✔ Favorable Risk-Reward Ratio – 1:1.18 to TP1, 1:2.56 to TP2.
💡 Stick to the plan, manage risk, and trade smart! 🚀🏆
🔗 #StockTrading #SMCI #BreakoutTrade #TechnicalAnalysis #MarketTrends #ProfittoPat

After being bullish on SuperMicro for over a year, Milton Berg nHere are Milton's criteria for a Climax Top.
For the record, climax top in NASDAQ:SMCI is not a sell signal on the broad market, which Milton also has very strict rules for. But he discussed it in the context of typical action seen at the end of a bull market.
X dot com /JackFarley96/status/1763691194905670125

Breakout NeededGood day Team:
If we can get a bullish MACD crossover with a strong upward break out, we might have a nice short term bullish momentum. Be safe!

SMCI Super Micro Computer: SHORTI am not looking at Technical analysis etc.
I am looking at spike up and spike down.
I have been looking at those for 8 years at least 8 hours a day.
This beast is a sell short term.
My publications are not trading or investment advices.. Do your own analysis. I am not responsible for your trades.

SMCI: Sell ideaOn SMCI we would have a high probability of having a bearish trend given the configuration of the candles on the chart.

$SMCI (SUPER MICRO COMPUTER): AI-DRIVEN GROWTH AMID GOVERNANCESMCI (SUPER MICRO COMPUTER): AI-DRIVEN GROWTH AMID GOVERNANCE WOES
1/8
Super Micro Computer ( NASDAQ:SMCI ) just revealed prelim Q2 FY2025 sales of $5.6–5.7B (+54% YoY), riding AI’s wave. But delayed filings & margin pressure spark caution. Let’s dig in! 💻⚡️
2/8 – REVENUE & EARNINGS SNAPSHOT
• Q2 sales: $5.7B (vs. $5.9B est.), EPS: ~$0.59 (est. $0.64)
• Full-year outlook trimmed to $23.5–25B (was $26–30B)
• Non-GAAP gross margin: ~11.9%; operating margin: ~7.9%—still under pressure 🏭
3/8 – KEY FINANCIAL EVENTS
• $700M in 2.25% convertible senior notes → fueling AI server growth
• Filing delays (10-K, 10-Qs) → must meet Feb 25, 2025 to avoid Nasdaq delisting
• New auditor BDO checks the books—no fraud found, but concerns linger about governance 🧐
4/8 – GOVERNANCE & INVESTIGATIONS
• Ongoing SEC & DOJ probes after Hindenburg’s short-seller report
• CEO says they’ll meet filing deadline, but trust is still shaky
• Market watchers: “No fraud found” is good, but the uncertainty stings 🤔
5/8 – SECTOR CONTEXT
• Competes with Dell ( NYSE:DELL ), HPE ( NYSE:HPE )—both see AI demand, but SMCI more focused
• SMCI trades at ~11x 2025 earnings (vs. Dell at 15x, HPE at 12x)
• Could be undervalued—but only if governance issues don’t overshadow the AI growth story 🚀
6/8 – RISKS
• Margin Pressure: R&D + product mix + potential GPU shipment delays (Nvidia Blackwell)
• Debt Load: Total debt now ~$1.9B, plus $700M in convertible notes
• Regulatory Overhang: Missing that Feb 25 deadline = serious delisting risk ⚠️
7/8 Is SMCI worth the gamble?
1️⃣ Bullish—AI potential outweighs the risks
2️⃣ Neutral—Need clarity on filings & margins
3️⃣ Bearish—Governance red flags trump growth
Vote below! 🗳️👇
8/8 – STRATEGIC OUTLOOK
• 70%+ revenue from AI platforms → big edge if servers remain hot
• Partnerships w/ Nvidia & push into liquid-cooled data centers
• Delaying or messing up compliance could sabotage all that potential 🌐

Long Straddle Options Idea: Strike $39 or $39.50 or $40, Exp 2/2Long Straddle Options Idea: Strike $39 or $39.50 or $40, Exp 2/2
Disclaimer

2/10/25 - $smci - lol2/10/25 :: VROCKSTAR :: NASDAQ:SMCI
lol
- you all know what happens when reputation goes to a diddy party and takes an azz chapz photo with "lady" "gaga".
- nobody is going to scale with these guys, guys
- it's hard enough to buy dell, hp... even the *covers left eye* oracle is an overvalued POS that tells a nice story
- bitcoin, nxt, uber, tsm... nvda... come on guys. it's hard enough to own legit stuff in this overbaked cake. don't make your life harder than it already is. welp. i'm sure i'll have the only honest but "bearish" post that tells the truth.
- truth sucks. but it's the scarcest asset. aren't we all in the business of consuming scarce assets? anyway... have a wonderful week my friends. bit of a digression post than usual.
V

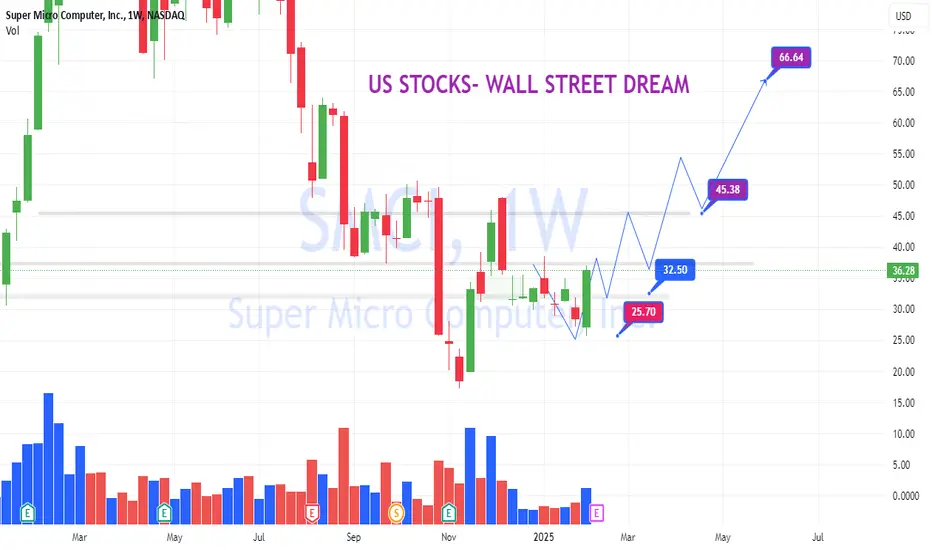
SMCI Bull Flag completed and targeting $65.Three months ago (November 07 2024, see chart below), we issued a strong buy signal on Super Micro Computer Inc (SMCI), after the stock had declined by more than -85% from its All Time High (ATH):
The signal was an instant success, as the price rebounded on the following week. Our perspective hasn't changed and today, with the stock up currently by more +13% intra day, is another reason why.
Last week the price made an excellent rebound on its 1W MA200 (orange trend-line), solidifying this level as the new Support and turning out to be a huge demand level that completed the Bull Flag pattern of December 09 2024 - January 27 2025. As you can see , the 1W MA200 was also on the symmetrical Support Zone that only broke on the 'fake-out' of November's accounting scandal peak.
The interesting take on this 1W chart is that every similar Bull Flag since the 2020 COVID crash, tested the 1.5 Fibonacci extension before the next technical pull-back. As a result, we expect a $65.00 test, which would exceed the 1W MA50 (blue trend-line), before a new 2-month correction.
-------------------------------------------------------------------------------
** Please LIKE 👍, FOLLOW ✅, SHARE 🙌 and COMMENT ✍ if you enjoy this idea! Also share your ideas and charts in the comments section below! This is best way to keep it relevant, support us, keep the content here free and allow the idea to reach as many people as possible. **
-------------------------------------------------------------------------------
💸💸💸💸💸💸
👇 👇 👇 👇 👇 👇

SMCI: Bottom is being confirmedSMCI: Bottom is being confirmed
-Accumation on Inversed Head n Shoulder pattern.
-Less supply volume at the bottom.
-Key level and demand zone support.
.
Let's wait n see!
SMCI - Super Micro Computer, Inc.Super Micro Computer, Inc. engages in the distribution and manufacture of information technology solutions and other computer products. Its products include twin solutions, MP servers, GPU and coprocessor, MicroCloud, AMD solutions, power supplies, SuperServer, storage, motherboards, chassis, super workstations, accessories, SuperRack and server management products. The company was founded by Charles Liang, Yih-Shyan Liaw, Sara Liu, and Chiu-Chu Liu Liang in September 1993 and is headquartered in San Jose, CA.

Bullish Bat?If we are seeing a bullish bat here than SMCI's ability to return to its original price of around $100 depends on several key factors:
1. Market Sentiment & AI Growth
Supermicro has become a critical supplier for AI-driven data centers, leveraging NVIDIA's GPUs.
If AI and high-performance computing demand continues to grow, SMCI's revenue and stock price could remain strong.
2. Addressing Accounting Concerns
Past SEC settlements and ongoing Hindenburg Research allegations could create volatility.
If Supermicro proves its financial integrity and remains compliant with regulations, investor confidence could return.
3. Competition & Supply Chain Risks
The company faces competition from Dell, HPE, and Lenovo, which could impact market share.
Geopolitical risks with China (since Supermicro's manufacturing is partially based there) could also play a role.
4. Valuation & Market Cycles
Supermicro traded at $100 before its massive AI-driven rally in 2023-2024.
If AI spending slows, or the market perceives SMCI as overvalued, it could experience a correction.
Technical & Historical Perspective
SMCI was under $100 before 2023, but its AI-driven business significantly expanded.
A return to $100 would imply a massive decline of over 85%, which would require a major financial or industry-wide collapse.
Realistic Possibility?
Unlikely in the near term unless there is a major accounting scandal, a sharp downturn in AI-related spending, or a market-wide tech crash.
More realistic downside? If AI demand slows, SMCI could correct to around $300–$400 rather than $100.
If you’re considering shorting or trading it, timing will be critical.

SMCI: UptrendOn SMCI we are in a situation of bullish trend with the break of the vwap and the resistance line. The objective is to reach 46.94 dollars.

A Bet on Green Chip and Data Center InfrastructureSupporting Arguments
Fundamental Undervaluation Due to Past Issues: SMCI experienced a significant sell-off following unproven allegations of financial reporting fraud. Currently, the company trades at a discount compared to peers that only partially focus on data center infrastructure solutions.
Financial Results Release for FY 2024: The market is pricing in a potential NASDAQ delisting due to delays in financial reporting. The current deadline for the company is February 25, which is likely to be a decisive moment for this investment thesis.
Investment Thesis
Super Micro Computer Inc. (SMCI), founded in Silicon Valley, has been a niche supplier of server solutions for data centers for over 15 years. The company has significantly disrupted the server and storage systems market, achieving growth rates surpassing its competitors. SMCI offers a comprehensive 360° solution, covering hardware, support, software, and security. An independent audit found no evidence of fraud or misconduct by the company’s management, yet the stock trades at highly attractive valuation multiples while maintaining strong growth potential.
Fundamental Undervaluation Due to Past Issues. Currently, SMCI trades at a forward P/E ratio of 10, while its closest competitors (Dell, Lenovo, HP), which offer only partial infrastructure solutions, trade at an average multiple of 11.6. The emergence of more efficient AI infrastructure solutions in China (such as DeepSeek) is putting pressure on the industry. However, Jevons' paradox suggests that increased efficiency may drive demand for AI development among companies that previously avoided entering the market due to high barriers to entry. Even if demand for data center infrastructure weakens, it remains positive due to the exponential growth of global data consumption.
FY 2024 Financial Results Release. The company must publish its financial reports by February 25. Currently, the market fears a potential delisting, but we believe this risk is low. It is important to note that SMCI recently underwent changes in its finance department, which naturally affected the reporting timeline. It is likely that the company’s management has reviewed and adjusted its financial disclosure processes. Given that SEC reviews have been positive and there have been no major delays in the past, it is difficult to imagine that the company will fail to report on time. The next month will be crucial for the stock, and we see a high probability of a valuation reassessment by investors.
Our target price for SMCI stock is $40, with a "Buy" recommendation. We recommend setting a stop-loss at $22.5.
