SMH - Neutral but Slightly Bearish Nearterm
Not trading advice. Just journaling my chart entry here.
SMH trade ideas

SMH Existing Long Position (Wave 5 Bullish)Notice Semiconductors is leading the charge with the S&P which is positively correlated. Updates on existing longs on SMH that is likely to extend this terminal rally into 220-230 until there is irrefutable evidence to consider the top is in.


Halloween is over - but this is still spooky!Semiconductor ETF (SMH Monthly candlestick chart, displaying a large upper shadow for October.

SMH Existing Long Position (Wave 5 Bullish)Updates on existing Long position on SMH from last week that have moved in the money. SMH is unfolding into wave 5 that could reach 190-195. The key is to stretch existing profits on SMH with the daily chart that shows SMH terminal wave 5 rally is in progress.
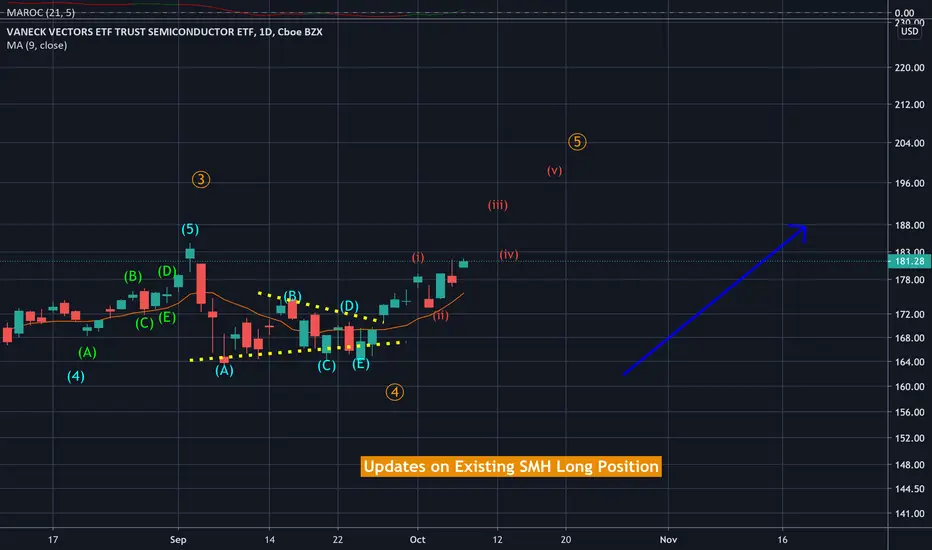
SMH Existing Long Position (Wave 5 Bullish)Updates on existing Long position on SMH from last week that have moved in the money. SMH is unfolding into wave 5 that could reach 190-195. The key is to stretch existing profits on SMH with the daily chart that shows SMH terminal wave 5 rally is in progress.

$SMH Chart review$SMH looking great! retesting last month's range and above all EMAs. if we hold, could see ATH test.

SMH Bullish Trade Setup (Potential Breakout) We’re tracking a breakout pattern on SMH as semiconductors are setting up for another wave higher into wave (v). Look to setup Longs on SMH expiring Nov-Dec. Detailed Trade Execution on Video Update.


Breakdown of Semiconductors Simple view of this critical sector breaking through key technical trendlines.
Our first bearish sign was the break earlier in August, which held, and rallied back above the original broken trendline. That quickly stopped as momentum ran out, and it's now breaking through multiple trendlines with bulls at max long. This can potentially fall significantly given the overweight bullish positioning and the stretched overbought price.

SMH/QQQ Ratio ChartMy Favorite Ratio Chart. Semiconductors are a leading indicator of the Tech sector.
Typically has a timely divergence with few false signals.
Best,
RH


SMH on watchLong in and above box. Short below box or wait for long pull back entry from lower targets.


Cup and Handle SMHETF that appears to be trading in a cup and handle pattern
Hypothetical break out is 152.7
Targets : 174 187 197
Stop is set below handle low or mid cup
Be safe!

Semiconductor ETF Has Failed to Break OutOne of the biggest stories in the last month has been the breakout in the Nasdaq-100 . But the Market Vectors Semiconductor ETF has failed to join the breakout.
It’s not a surprise because chips are economically sensitive and struggle when manufacturing slows. That’s happened now.
SMH’s lack of breakout shows weak relative strength and fundamentals. That could give bears more of a reason to expect downside if selling spreads in the broader market.
It also creates a potential risk-management zone for traders taking bearish positions.
Finally, the relative weakness in chips focuses attention on Nasdaq stocks that have actually broken out – like software and e-commerce . Traders may want to expect more strength in those groups.
SMH might not be a short yet, and it might still break out if the S&P 500 holds 3,000. But if the opposite happens and volatility picks back up in July, this could be a corner of technology where the bears will be more active.

$SMH Semiconductors Etf Tired
The run in the SMH has been amazing from the March lows and is now back at the Feb highs,
Tuesday some heavyweights like NVDA AMD & MU started to show some signs that some consolidation is needed.
Momentum, Volume, ACD are beginning to head south.
It may be wise to take some profits in chip\semi stock until the breakout or retrace is complete.

