SMH channel top or the beginning of a 1929 blowoff The chart posted is that of the SMH etf as you can see based on a parallel channel working off the two major lows .that we are now at the top If we were to break above this and by 5 % rule then I would say we are in a BLOWOFF
SMH trade ideas

SMH analysis for week of July05 2024Bear flag consolidation , rejected from fibs 50 level ,
expectation - more downside or side ways on flag as volume seem to be down on the push up


$SMH #BULLFLAG #PERFECT2.0 #300PT END OF SUMMERThis Bullflag break out has plenty of meat left on the bone so to speak...
I mentioned "perfect" when looking at NVDA before earnings...
Well NASDAQ:SMH is perfect imo for a #WHITEBOYSUMMER Play...
Trend/Sector is bullish
Breakout has been Confirmed.
Stoch is STRONG, can remain that way for months...
- Prophecies R Us

For those trying to short SMH (semiconductors)..... DON'TThis is where I think we are in the very long term cycle for semiconductors since the 2008 bear market lows.
It's a bull market. And we're only about half way through......
May be due a 10%-15% correction over coming months but ultimately headed higher (a lot higher).

You Must Watch Semiconductors vs. Nasdaq-100The chart below shows a simple equation: NASDAQ:SMH / NASDAQ:QQQ to gauge the relative performance of the Semiconductors (SMH) vs. the Nasdaq-100 index (QQQ).
The SMH ETF includes companies like NVIDIA and other leading chip manufacturers, which are critical to powering AI advancements.
On the other hand, the QQQ ETF comprises 100 major tech-related companies, including giants like Apple and Amazon, along with some semiconductor companies.
Although there is some overlap between the two ETFs, this comparison serves as a general gauge of the semiconductors' performance relative to the broader tech sector represented by the Nasdaq-100.
Observations on the importance of this comparison:
Sector Strength Insight: By analyzing the performance of semiconductors relative to the Nasdaq-100, investors can gauge the strength and potential of the semiconductor sector within the tech industry.
Investment Decisions: Understanding these dynamics can inform investment strategies, helping to identify whether to allocate more resources to semiconductor stocks or maintain a broader tech investment.
Market Sentiment: The performance ratio can also reflect market sentiment towards different tech subsectors, providing insights into which areas might be overvalued or undervalued.
Risk Management: Recognizing extreme levels in the performance ratio can help in risk management, indicating when semiconductor stocks might be overheating relative to the broader tech sector.
By keeping an eye on this ratio, investors can better navigate the tech landscape, making more informed decisions about where to focus their investments.

$SMH ETF Algorithm Momentum Indicator Started Accumulating on May 6, with our buy alert from our proprietary algorithm momentum indicator. ### Algorithm Momentum Indicator
The Algorithm Momentum Indicator (AMI) is a sophisticated trading tool designed to identify the strength and direction of market trends. By leveraging advanced computational algorithms, the AMI analyzes price movements, trading volume, and historical data to provide traders with precise signals for potential buy or sell opportunities.
#### Key Features:
1. **Trend Detection**:
- AMI uses mathematical models to detect the initiation and continuation of market trends.
- It helps traders identify whether an asset is in an upward (bullish) or downward (bearish) trend.
2. **Signal Generation**:
- The indicator generates clear signals based on momentum shifts, alerting traders when to enter or exit a position.
- Signals are typically represented by graphical elements such as arrows or color changes on the trading chart.
3. **Customizable Parameters**:
- Traders can adjust the sensitivity of the indicator by modifying its parameters to suit different trading strategies and timeframes.
- Customizable settings allow for fine-tuning to match individual risk tolerance and market conditions.
4. **Integration with Trading Platforms**:
- AMI can be integrated with popular trading platforms like MetaTrader, TradingView, and NinjaTrader.
- This ensures seamless usage and real-time analysis during trading sessions.
5. **Backtesting Capabilities**:
- Traders can use historical data to backtest the AMI, evaluating its performance over various market conditions.
- This feature helps in optimizing the indicator for better accuracy and reliability.
6. **Visual Representation**:
- The AMI often includes visual aids such as histograms, lines, or oscillators to represent momentum.
- These visual tools make it easier for traders to quickly interpret the indicator’s output.
Benefits:
- **Enhanced Decision Making**: Provides actionable insights that help traders make informed decisions.
- **Risk Management**: By identifying potential trend reversals, the AMI aids in managing and mitigating risks.
- **Versatility**: Suitable for various markets including stocks, forex, commodities, and cryptocurrencies.
- **Time Efficiency**: Saves traders time by automating complex calculations and providing ready-to-use signals.
Use Cases:
- **Intraday Trading**: Ideal for short-term traders looking to capitalize on quick market movements.
- **Swing Trading**: Helps swing traders identify medium-term trends to maximize gains.
- **Long-term Investing**: Assists long-term investors in confirming trend directions for strategic positioning.
The Algorithm Momentum Indicator is a powerful tool that combines advanced algorithmic techniques with practical trading insights, making it an essential component of any trader's toolkit.

Opening (IRA): SMH 2 x July 19th 210/215 Short Put Vertical... for a 1.00 in credit.
Comments: Part two of delta adjustment trade ... .
Instead of rolling up the 205/215 short put vertical, I closed it out (See Post Below), and then re-erected a 2 x 5 to delta balance against my call side, whose short leg is at the -32 delta strike.
This doesn't increase buying power effect, since the 2 x 5 is equivalent to the 1 x 10 on the call side.
The end result is a 2 x 210/2 x 215/255/265 iron condor, -5.79/3.42 delta/theta on which I've netted 3.36 in credits.

Look. If NVDA 1600, SMH could be 300I just longed some more SMH here due to NVDA strength and Semi strength overall
My March 2024 prediction was that NVDA would hit 1000. now that I was right on that move, I believe I'll get my NVDA to 1600.
I'm not holding NVDA calls though, SMH is cheaper for me,
Bears can stay hesitant all 2024 if they want. We entered a 5 year bull cycle. Quote me in 2030
NFA - Good luck

Closing (IRA): SMH 205/215 Short Put Vertical... for a .87 debit.
Comments: First part of an adjustment trade. Instead of rolling the short put vertical aspect of my 205/215/255/265 up to delta balance, I'm closing it out.
Then, I'll re-erect a 2 x 5 (the equivalent of a 10-wide) to delta balance against the call side, whose short leg is at the 32 delta.

SELL SMH (ETF) Long copperWhen this ratio hits 55 its the biggest signal the semiconductor equities are overbought and expensive vs copper.
So sell semiconductor etf (SMH) and get long copper futures for a ratio target of 25x

SMH PutNASDAQ:SMH - Buy Jun-21-24 $235 Put @ $7.35 Limit to Open
Similar to XLC, downward bias. Expectation that markets will see a correction for a few weeks.

$SMH Parallel Channel Uptrend Continues NASDAQ:SMH Parallel Uptrend Continues
The SMH ETF (VanEck Semiconductor ETF) is an exchange-traded fund designed to track the performance of the MVIS® US Listed Semiconductor 25 Index (MVSMHTR). This index is composed of the 25 largest U.S.-listed companies involved in semiconductor production and equipment.
**Key points about SMH ETF:**
* **Objective:** To replicate the price and yield performance of the MVIS® US Listed Semiconductor 25 Index as closely as possible, before fees and expenses.
* **Investment Focus:** Companies engaged in the design, manufacturing, and distribution of semiconductors.
* **Holdings:** Includes well-known semiconductor companies like Nvidia, Taiwan Semiconductor Manufacturing, Qualcomm, etc.
* **Market Exposure:** Provides investors with targeted exposure to the U.S. semiconductor industry.
* **Trading:** Trades on major stock exchanges like other ETFs.
**Why invest in SMH ETF?**
* **Diversification:** Offers a diversified portfolio of leading semiconductor companies.
* **Growth Potential:** The semiconductor industry is vital for technological advancement and has significant growth potential.
* **Convenience:** An easy way to gain exposure to the semiconductor sector without buying individual stocks.
* **Liquidity:** Typically high trading volumes ensure easy buying and selling of shares.
For further information, you can refer to the following resources:
* **VanEck SMH ETF Page:** (www.vaneck.com)
* **ETF Database:** (etfdb.com)
* **ETF.com:** (www.etf.com)
Remember, investing in ETFs involves risks, and past performance does not guarantee future results. Always conduct thorough research and consider your investment goals before making any decisions.

$SMH: Is 235 Ready?The semiconductor sector is seeing incredible strength today and it looks poised to continue. Tech and Nasdaq may still be preferred even if we see TVC:DXY rise off the lows. Best of luck traders!

Closed (IRA): SMH July 19th 189/199/275/285 Iron Condor... for a 1.17 debit.
Comments: Mixing and matching profitable put wing with profitable call wing from iron condors put on at different times (See Posts Below) to de-risk running into NVDA earnings on 5/22. (NVDA is around 21% of SMH holdings).
The resulting setup is a July 19th 205/215/255/265 on which I've collected a net 3.23 in credits; delta/theta -.28/3.45.
I'll look at doing a delta adjustment post-earnings if necessary.

INTC losing in a winning sectorSemiconductors have been strong performers and this period of the year has become increasingly strong for them from a seasonality perspective. AI is being described as one of the fastest adopted technologies of all time. So it's fascinating to see INTC continue to underperform all of its major cohorts in in the space.

Opening (IRA): SMH July 19th 205/215/275/285 IC... for a 2.17 credit.
Comments: An additive delta adjustment to the current SMH IC I have on. (See Post Below).
With the original setup's short call aspect converging on -25 delta and the short put converging on +10, selling a skewed IC with the oppositionally delta'd short call/short put (i.e., at the +25 short put and the -10 delta short call) to bring back the position back to net delta flat with 63 days until expiry.
4.40 total credits collected with a current delta/theta of 1.02/5.81.

SMH back within Bull range. Let's see some breakouts nowSMH had been holding 220-223 for a while, and is just today hitting 225, next stop 235 IMO.
Opinion. Hasn't broke out yet and is showing bull strength AT major resistance.

Opening (IRA): SMH July 19th 189/199/255/265 Iron Condor... for a 2.23 credit.
Comments: A small engagement trade in the semiconductor ETF (31.5% 30-Day IV).
Going somewhat wide here with the deltas, with the short option legs camped out at 16 delta on both sides. I generally like to collect one-third the width of the wings in credit for these, but am going a little more long-dated than usual, so want to give it a smidge more room to be wrong.
The assumption here is neutral, with the bet being that it slops around between my short option strikes. I'll generally look to take profit at 50% max and/or adjust sides on approaching worthless or on side test.
Metrics:
Buying Power Effect: 7.77
Max Profit: 2.23
ROC at Max: 28.70%
ROC at 50% Max: 14.35%
Delta/Theta: .37/3.01

SMH rising wedge and gap fill at $212 levelChart is pretty clear. There is a big gap at $212 and a number of points of confluence. The lower trend line on rising wedge aligns with the gap, and other key levels. I'm using SOXS for the gap fill.

SMH heads up at $209.43: Golden Genesis fib may Break-n-RetestSMH just hit a Golden Genesis fib at $209.43.
That fib is reinforced by a Covid Stimulus fib.
This is a major landmark in this ETF's history.
$ 209.43 - 212.89 is the immediate resistance.
$ 236.36 - 238.96 is the next major resistance.
$ 191.21 - 191.90 below is the first good support.
It is PROBABLE that we orbit this zone for a while.
It is POSSIBLE that we break and retest for late buy.
It is PLAUSIBLE that we get a pullback here and now.
Here is a full view of the Genesis Sequence:
==========================================================================================

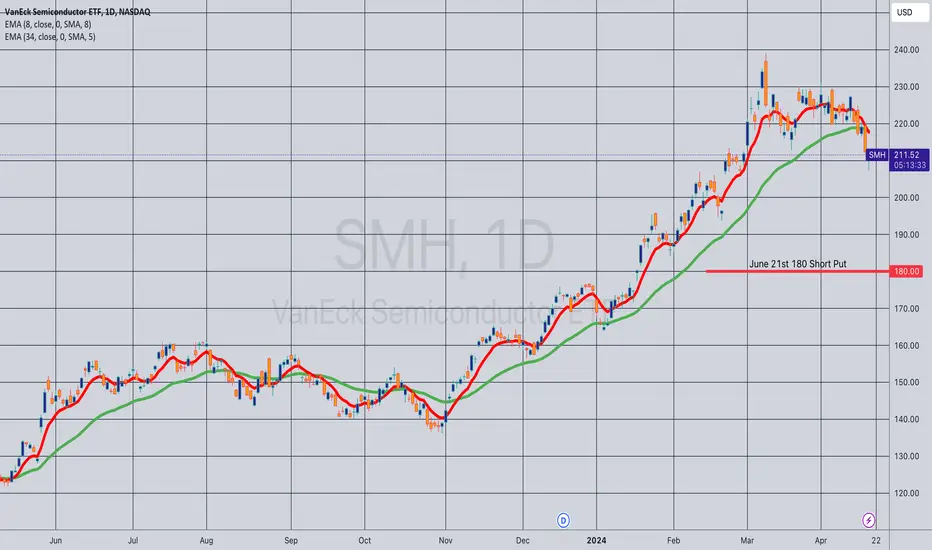
Opening (IRA): SMH June 21st 180 Short Put... for a 2.01 credit.
Comments: High IVR/IV at 75.1/35.1. Targeting the <16 delta strike paying around 1% of the strike price in credit to emulate dollar cost averaging into the semiconductor ETF.
I may look to ladder out at intervals if premium remains decent.
Opening (IRA): SMH July 19th 165 Short Put... for a 1.69 credit.
Comments: High IVR/IV at 78.9/34.5. Adding a rung out in July to my SMH position, targeting the <16 delta strike paying around 1% of the strike price in credit to emulate dollar cost averaging into the semiconductor ETF.
Generally, will look to take profit on the short put at 50% max.
