Cup and Handle - 67% Upside if we get the CUTS As of Friday, June 27, 2025, at 9:01:38 PM PDT, here's a breakdown of SoFi Technologies Inc. (SOFI) stock:
Current Price & Performance:
Last Price: $17.18 (as of 4:00 PM ET on June 27, 2025)
Today's Change: Up $0.41 (2.44%)
After-hours price: $17.22 (up 0.23% as of 8:00 PM ET on June 27, 2025)
Previous Close: $16.77
Today's Range: $16.84 - $17.52
52-Week Range: $6.01 - $18.42
Key Financials (as of March 31, 2025, Fiscal Q1 2025 reported April 29, 2025):
Market Cap: Approximately $18.99 billion
Earnings Per Share (EPS): $0.06 (reported), which beat the expected $0.031.
Revenue: $770.72 million (reported), which beat the expected $738.91 million.
Net Income: $71.12 million
Analyst Sentiment & Forecasts:
Consensus Rating: "Hold" based on 39 analysts.
13 Buy ratings
19 Hold ratings
7 Sell ratings
Median Price Target: $9.87 (This is lower than the current price, indicating some analysts believe it is currently overvalued based on their targets.)
High Estimate: $20.00
Low Estimate: $3.00
Recent News & Outlook:
SoFi recently reported strong Q1 2025 results, with revenue growing 20% year-over-year. While net income decreased 19% year-over-year, it was still significantly ahead of guidance.
The company is focused on expanding its financial product offerings and has seen strong growth in its user base.
Some analysts suggest that SoFi is establishing itself as a leader in the evolving digital banking landscape and could benefit from long-term trends as more young people transition into adulthood and begin their banking journey.
There are some potential concerns about economic issues and the elevated default risk associated with higher-risk loans compared to more established banks.
Recent news indicates SoFi's crypto plans now include stablecoins.
Important Note: Stock analysis involves inherent risks and predictions can be volatile. It's always recommended to conduct your own thorough research and consult with a financial advisor before making any investment decisions.
SOFI trade ideas

SOFI Long Setup – 2.83 Risk/RewardSOFI looks ready for a breakout. The price is consolidating just above the cloud after reclaiming the Kijun line. This setup offers solid upside if momentum follows through.
Entry: ~$13.46
Target: $16.37 (21.6% upside)
Stop: $12.43 (7.65% downside)
Risk/Reward: 2.83
Why I like this trade:
Clear support above the cloud and Kijun line
Strong recovery from April lows with higher lows forming
Tight risk with a decent breakout target
Ichimoku showing early signs of bullish trend resumption
I’m watching for volume to confirm and a daily close above $13.70 for conviction. Worth tracking if the macro backdrop holds up.
Let me know if you're in or staying on the sidelines.
#SOFI #Stocks #TradingSetup #Ichimoku #Breakout #RiskReward #SwingTrade #TradingView

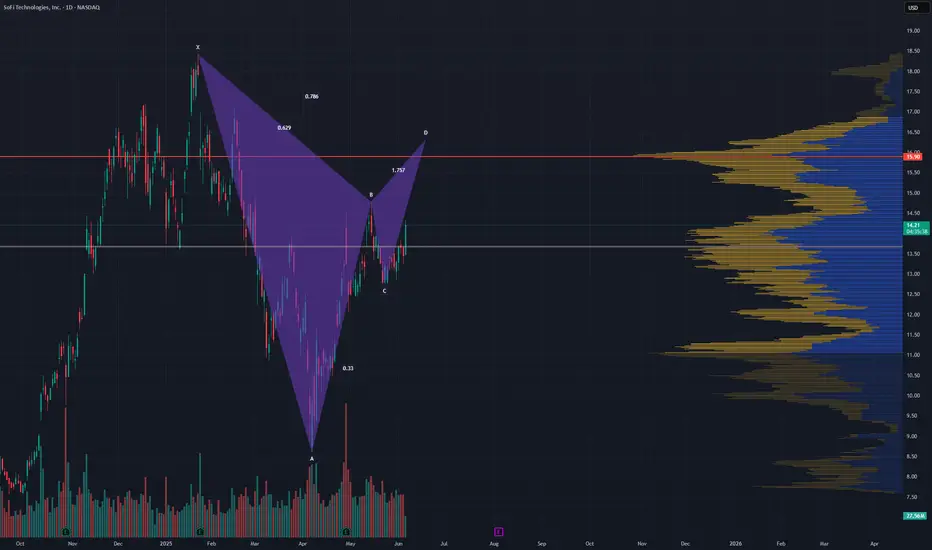
$SOFI looks like its forming a bearish Gartley Noticed this potential #Gartley #Harmonic on #SOFI the other day. I hope my 14c calls do get blessed with its completion.
I expect a retrace to 13.30 then 11.55 of the completion.
SoFi Technologies (SOFI, 1D)On the daily chart, SoFi has broken out of its descending trendline, confirmed the breakout with a clean retest of the 0.618 Fibonacci retracement level at $12.33, and is now building upward momentum from this demand zone. This “buy zone” is acting as a launchpad for a potential mid-term move toward higher resistance levels.
Key Fibonacci-based upside targets:
– $13.48 (0.5 retracement)
– $14.64 (0.382 retracement)
– $16.07 (0.236 retracement) — within the defined target zone
– Extended target: $18.37 (1.0 Fibonacci projection)
Technical structure highlights:
– Breakout of multi-month downtrend + successful retest
– Price now trading above key EMAs (50/100/200)
– Volume expansion on bullish candles confirms demand
– Daily momentum favors further continuation toward the $14–$16 zone
– Premium supply zone above $16 may slow initial momentum but offers long-term potential toward $18+
Fundamental context:
SoFi is evolving as a vertically integrated fintech platform with strong brand recognition and growing user engagement across banking, investing, and lending services. As the company narrows losses and strengthens recurring revenue, investor interest in SOFI is growing — particularly as market appetite returns for high-quality fintech with path-to-profitability models.
The technical breakout is confirmed. As long as price remains above the $12.33–$12.50 buy zone, the bullish scenario remains valid with targets toward $14.64 and $16.07. A breakout above $16 would activate the full expansion toward $18.37 in the mid-term.

SOFI Long TradePreferred entry here or lower on market open
TP1 14.85
TP2 15.45
Feel free to let partial open after

Another Key AreaPrice has returned to the 100 EMA at 14.01; will the Bulls have their way and pass 14.40 price and fill up the gap and test the 14.80 price area? Or will the Bears short away to the 200 EMA at 13.60?

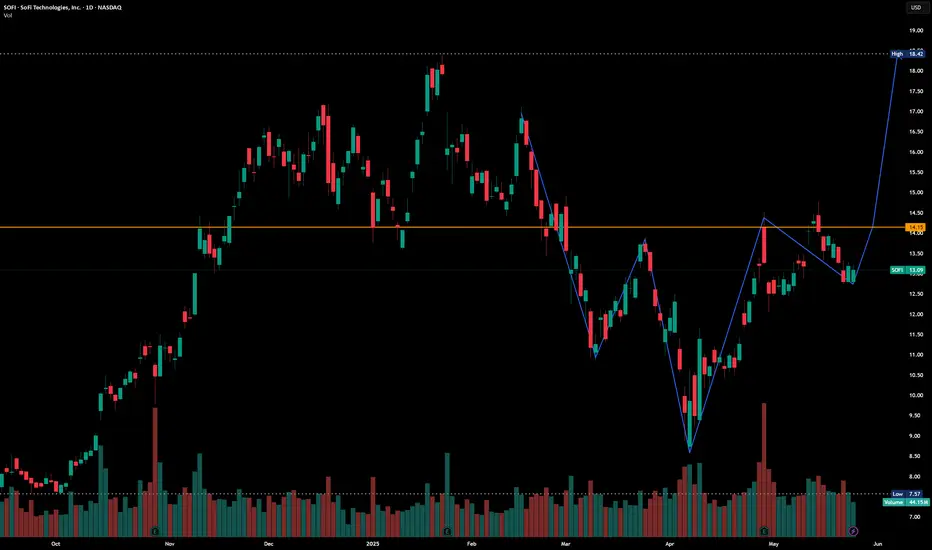
SOFI short idea, call me crazy but this is what I see, ElliotPer Elliot wave analysis, we are looking for Wave C in correction pattern.

Inverted H & SLeft Shoulder: Formed in late February.
Head: Created in March at the lowest point.
Right Shoulder: Recently completed in early June.
Neckline Breakout: The price is now testing or breaking above the neckline (~$15), which is typically a bullish breakout signal.

It’s time for SOFIThat $11 IPO price finally broke out and then had a solid back test before this last small move up. We have the weekly and monthly MACDs ready to push higher. Chart can easily retest the $24 range now

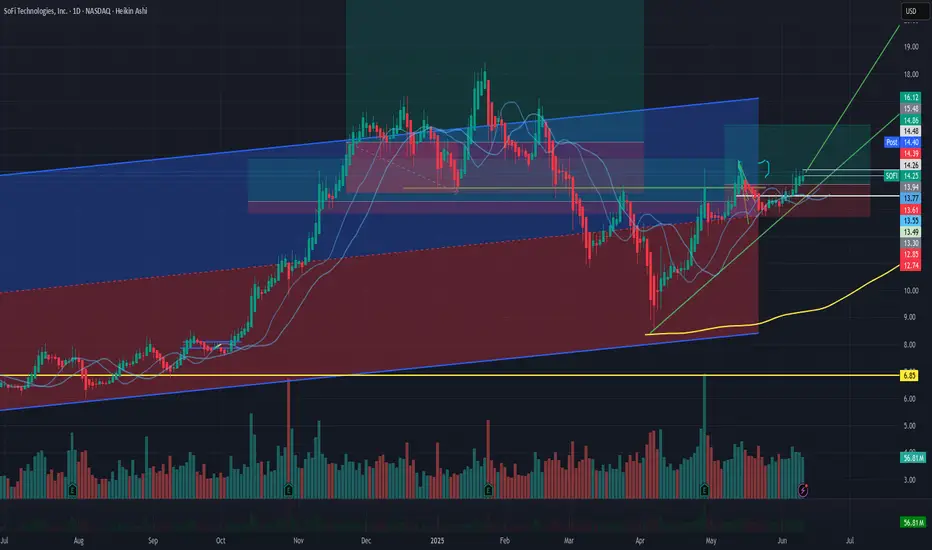
Can SOFI reach $30.00 ? SoFi Technologies has successfully broken out of a falling channel, reclaiming the $13.00 level — now acting as a strong support and technical base. This breakout follows a clear downtrend rejection structure (marked by multiple red arrows), and is now transitioning into a bullish reversal pattern.
📊 Technical Highlights
Breakout Point: $13.00 – now confirmed as strong support.
Structure: Bullish flag/channel breakdown followed by a clean breakout and retest setup.
Pattern Projection Target: $30.32 (based on flagpole extension), indicating a potential 137% upside.
Short-Term Resistance: $16.58 (local top), then $18.41.
Support Zone: $13.00 key level to hold for bullish continuation.
Volume: Elevated volume on breakout candles, confirming strong demand absorption at breakout.
🧠 Trade Expectation
Price may enter a short period of consolidation or shallow pullbacks above $13 before stair-stepping higher through $16.50 and $18.40. If momentum sustains, a measured move to the $30 zone is achievable.

Bullish flag on the verge of breakout.This is looking very similar to when it broke out the last time and went to 18+. I think we break out plus 15.
SOFI Weekly Call Setup – Bullish Flow into Friday Close🏦 SOFI Weekly Call Setup – Bullish Flow into Friday Close
📆 Date: June 6, 2025
📈 Bias: Moderately Bullish
🕒 Timeframe: 0DTE intraday swing to close
🧠 Multi-Model Consensus Summary
Model Bias Strike Entry Targets Stop Confidence
Grok Bullish 13.50C 0.33 $0.43 (+30%) $0.23 75%
Claude Bullish 14.00C 0.09 $0.18 / $0.27 $0.04 72%
Llama Bullish 13.50C 0.33 $0.50–$0.55 $0.17 70%
Gemini Bullish 13.50C 0.33 $0.50–$0.55 $0.17 70%
DeepSeek Bearish 13.50P 0.13 $0.20 $0.065 65%
✅ Consensus Direction: Moderately Bullish (4/5 models)
🎯 Key Level: $13.83 resistance; max pain = $13.50
📊 Catalyst: William Blair BUY recommendation adds support
📉 Contrarian View: DeepSeek sees fade toward max pain, but low volume = weak conviction
🔍 Technical Snapshot
Price: $13.69 (as of latest report)
Support: $13.50 (max pain & put wall)
Resistance: $13.83 (near R1 level)
Momentum: Short-term charts (5-min) bullish across MACD, EMAs
Volume: Below average, but rising near resistance
Volatility: VIX at ~17.7 → normal, quiet environment
✅ Trade Setup
Metric Value
Instrument SOFI
Direction CALL (LONG)
Strike $13.50
Expiry 2025-06-06 (Today)
Entry Price $0.33
Profit Target $0.50 (≈50% gain)
Stop Loss $0.23 (≈30% loss)
Size 1 contract
Confidence 71%
Entry Timing Market Open
🧠 Trade Management Plan
🎯 Take profit around $0.50–$0.55
🛑 Cut loss on break below $13.50 or if option falls to $0.23
📆 Time-based exit by today’s close (0DTE)
⚠️ Risks to Monitor
Strong resistance at $13.83 could cap upside
Theta decay on weekly option will accelerate after midday
Low volume = fewer buyers near top
Any adverse market news can drag the stock back toward $13.50

Touch 15 this week?Seems like it's somewhat moving in the right direction, I think a more realistic outlook is closing above $14 on Friday. Anything after that is just a bonus.

The Setback May Be Over!- Valuation multiples remain stable, yet stock prices appear to be under pressure due to declining profitability indicators — even though this effect may fade soon.
- Momentum persists, and positive analyst revisions are gaining strength. The stability in growth reinforces the reliability of these signals.
- A three-phase corrective wave seems to have ended, followed by the initiation of a new wave with the first impulsive leg already completed.
- A pullback may occur through a corrective mini-trend, and the trendline break reinforces this likelihood.
- NEVERTHELESS, the overall outlook remains highly positive, and a dollar-cost averaging strategy would be a rational approach.

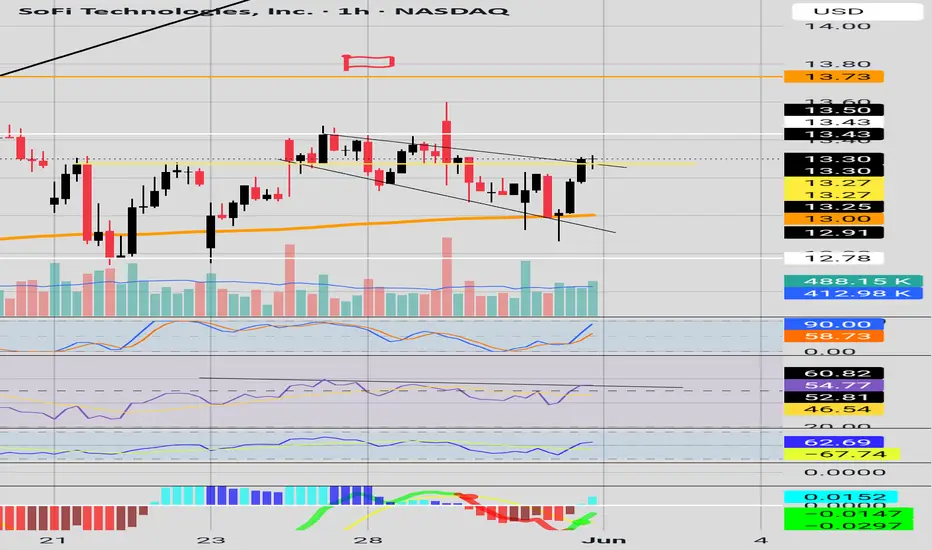
Need morePrice made a doji candle around a key level in yellow. Price has made a downward broadening opening wedge and a doji candle at the wedge upper resistance. MACD crossed over green but below the zero line. The rally may be short lived. We need price to break out of the wedge with volume and momentum or price to make Higher Highs and Higher Lows from the 13.27 price.
The Flag Will Price break down of the flag below to the 200 EMA in orange (12.15) or will price have a bullish break out of the bull flag pattern and out of the flip zone (in grey) to the 14.50 resistance. Even though price broke out of a parallel channel, it hit resistance around the 161.80% of the Fibonacci of that channel. We have two small body candles with long shadows in a flip zone which may indicate a change is on the horizon.

SOFI Charts are interesting.. SOFI is in making of Inverted head and Shoulder pattern. Current market Price is nearly $13. If cross $14.90 and sustain , it may got to $18 and $20.
$SOFICurrent Fib setup is set to a template recommended for beginners so that buy zone is a bit broad. Technically broke the uptrend that is started on in mid march.
I do expect more pull back but as soon as there is confirmation of trend reversal and we are back in an uptrend time to take Calls on $SOFI. Based on what I have modeled here, I think it is a good position as long as we get some sort of turn around in the green buy zone.
I would also be prepared to purchase now incase prices recover faster than expected.
I am definitely a younger trader and I am trying to sit on my hands more and find more confluence.
on the daily, the 9/20 Day EMAs have crossed through the 200 day EMA as well.
Please feel free to share any feedback
Iron sharpens iron

SOFI Bullish Setup Above $13.50 Targeting $17.50SOFI is showing strength above the $13.50 level after bouncing off the middle Bollinger Band. Increasing volume and early MACD recovery suggest a potential continuation toward the next resistance at $17.50.
Trade Setup:
• Entry Zone: $13.50 - $13.80
• First Target: $15.50
• Second Target: $17.50
• Stop Loss: Below $12.80
Technical Analysis Highlights:
• Price holding above the middle Bollinger Band.
• Increasing trading volume.
• Early bullish signals on MACD.
Recommendation:
Consider buying above $13.50 with targets at $15.50 and $17.50, managing risk below $12.80.

Buckle up. We are on the trampoline. PT 16Looks like the 48 hour sell off on news and short squeeze. Options volatility crush in play. look for rebound to the upside at these levels. downside price 12.50 risk. Upside out 15, 16.

Sofi pull back short flush. Trade to upside. 16 PT 12.5 RiskIt appeared that this sell off is a systematic volatility take profit and short attack. Looking to enter a trade here. Consider taking profit at 15.5- 16.

Fintech's Hidden Strength Positioning for Breakout Rally Current Price: $13.18
Direction: LONG
Targets:
- T1 = $13.80
- T2 = $14.30
Stop Levels:
- S1 = $12.75
- S2 = $12.20
**Wisdom of Professional Traders:**
This analysis synthesizes insights from thousands of professional traders and market experts, leveraging collective intelligence to identify high-probability trade setups. The wisdom of crowds principle suggests that aggregated market perspectives from experienced professionals often outperform individual forecasts, reducing cognitive biases and highlighting consensus opportunities in SOFI's stock movement.
**Key Insights:**
SoFi Technologies has shown resilience in the competitive fintech sector. Despite facing regulatory challenges and broader industry headwinds, its focus on technological innovation and expanding member growth places the company in a strong position for future gains. Many professionals believe SoFi's ability to execute in areas like personal lending and banking technologies is pivotal to its long-term success.
Current technical indicators signal that SOFI is consolidating near key resistance at $13.50, suggesting a potential breakout if broader market sentiment remains positive. Traders should pay attention to tightening price actions as this may indicate strengthening momentum for an upward move.
**Recent Performance:**
In recent months, SOFI has been trading near its 52-week high, reflecting investor optimism in its growth strategy. However, it has struggled to breach critical resistance levels, resulting in range-bound trading. The stock has managed to stay afloat during sector-wide fintech volatility, outperforming some of its peers and exhibiting stronger-than-expected stability.
**Expert Analysis:**
Market insights reveal that SoFi's innovative approach to banking and lending makes it a standout in the fintech sector. Experts believe breaking above $13.50-$14.00 resistance could set the stage for a momentum rally. Additionally, positive developments in upcoming earnings reports could serve as a catalyst to sustain bullish sentiment. The relative lack of negative news further supports technical-driven opportunities in the short term.
**News Impact:**
While no major headlines have surfaced to impact SOFI drastically, broader market dynamics and macroeconomic sentiment remain key factors for its movement. Recent indications of stabilization within the fintech regulatory environment bode well for SoFi’s growth outlook. Investors are encouraged to monitor lending data and fintech innovation metrics for future developments that align with a robust trading strategy.
**Trading Recommendation:**
With tightening resistance and growing optimism in SoFi’s disruptive fintech model, a long position appears favorable over the next trading cycle. Keep a watchful eye on the $13.50 level for early signs of a breakout. Strong execution in earnings and member growth metrics could drive the stock well beyond initial targets. This trade setup provides a balanced risk-reward profile with well-defined stop losses and achievable upside targets.

Supply ZoneSOFI is still facing resistance at the top of a parallel channel, and consolidating. It fought a supply zone and fail on April 29. SOFI need to clear 13.80 with some bullish candles and volume to *hopefully* start and uptrend.
