Idea for $SOFI]Hey guys, I have recently started trading and thought i'd share this cool trading idea, SOFI is currently in a descending channel right now, and it is near the 13.64 level testing it, if tomorrow we can break that resistance level I can see us breaking the trendline and bouncing bullish out of the channel. On the 5 minute chart it is also forming a symmetrical triangle pattern, and if we can break out of it, I am going in with calls. Hopefully we see some strong volume as well. However, there is a chance we break bearish and continue the channel down. We'll see what happens at opening bell guys, GOOD LUCK 🤞.
SOFI trade ideas

SOFI long term prediction (90 days)SOFI is perfect for a swing trade right now. This is a great entry point. I cannot tell you what to buy or sell as I am not a financial advisor.


SofiSOFI best price AVG is $9 best to sell 16-17
However if you do not trade this stock 2025 price could easily reach $30 since the Management doing a great job.

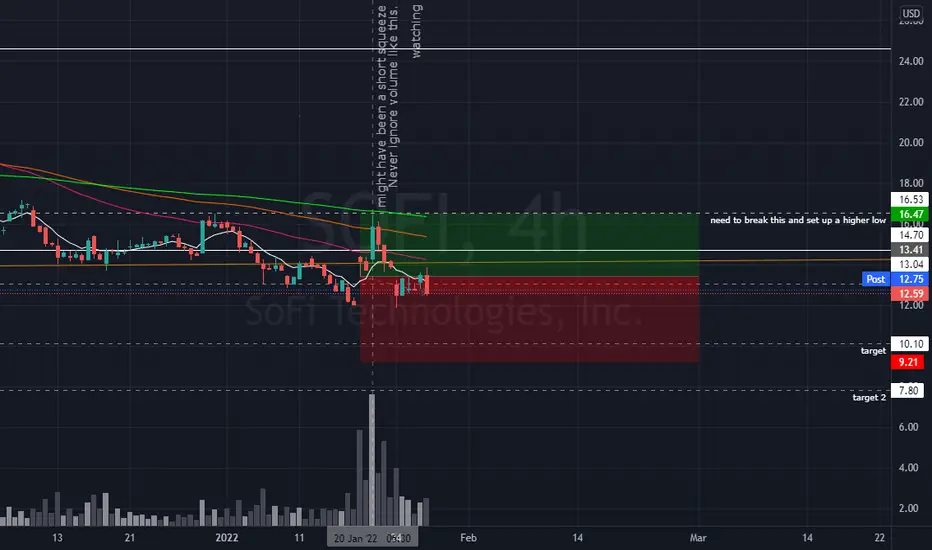
SoFi Technologies, Inc (NASDAQ: $SOFI)Short term target: 11.80
Key level: 10.50
If the market keep going down and SOFI get under 10.50 the stock will get weaker and will go to lower levels.

Sofi Watching closelyWatching for improvement on weekly storsi, which at the moment says we are going lower. but that volume can not be ignored. Eyes on this one.
$SOFI Short Term ReboundOur view is positive for a short term rebound as long as the price stays above the $12.40 pivot
The MACD must break above zero to trigger any additional gains

$SOFI Key Levels, Analysis & Targets. - REQUEST$SOFI Key Levels, Analysis & Targets. - REQUEST
By request for @StockTri
SOFI is definitely in a downtrend still… If you’re already long then I would only add at the green support levels and maybe at the blue trendline…
BUT If it breaks below those levels I would wait until the macD breaks above the centerline again before doing anything else… since there’s just about no support under there…
If you can train yourself to always think in terms of support and resistance levels you will do well.
I hope this is helpful.
——————
I am not your financial advisor, but I will happily answer questions and analyze to the best of my ability but ultimately the risk is on you. Check out my ideas, but also do your own due diligence.
I am not a bull. I am not a bear. I just see what I see in the charts and I don’t pay too much attention to the noise in the news.
If you want me to analyze any stock or ETF just leave me a comment and I’ll do it if I can. (If I have time)
Have fun, y’all!!
(\_/)
( •_•)
/ >🚀

SOFI | InformativeNASDAQ:SOFI
I'll open SHORT/LONG position based on bearish-bullish lines on the chart, it could have a break-out, but personally I expect a pull-back.
*This is my idea and could be wrong 100$

Sofi Green in a Sea of REDHello Traders,
Switching it up a bit and posting one for the stock boys and girls.
Bullish Falling wedge breakout
Bullish Divergence on the RSI
Bullish MACD Cross
Large Buy Volume
Entry: Anywhere near $14.23
Stop Loss: $11.92
Take Profit: $19.10
Have a Green week!
Savvy

$SOFI - Back above lower trend line of sideway channelBounced from Jan 2021 congestion area of $12ish (see the yellow line). If we look at Jan 2021 area SOFI bounced big time with gigantic candle from that area. We are seeing the same here as well coincidentally the bounce was spurred by the bank charter announcement. With the price back in the side way channel, above prior strong support, we can expect the price to go towards the upper trend line of $24 area.
If the price manages to break above the upper trend line, the break out max target reach is $34 area.
Target 1 - $24
Target 2 - $34 (maximum breakout target)
Risk - Unable to break above $24 and retrace to lower trend line.
———————————————————
How to read my charts?
- Matching color trend lines shows the pattern. Sometimes a chart can have multiple patterns. Each pattern will have matching color trend lines.
- The yellow horizontal lines shows support and resistance areas.
- Fib lines also shows support and resistance areas.
- The dotted white lines shows price projection for breakout or breakdown target.
Disclaimer: Do your own DD. Not an investment advice.

$SOFI bullish run up if we hold our SP
if we hold our first support , it will be a good indicator for strong bullish momentum, and we will see a test for our 2 target levels.

SOFISoFi stock closed 13.7% higher on Wednesday after it announced that it had received the much-awaited regulatory approval from the OCC (Office of the Comptroller of the Currency) to become a national bank.
possible targets on Daily Chart
GooDLucK

SOFI - Breakout of Megaphone; An Uptrend in the MakingSOFI played out a megaphone on 15M charts; a megaphone which successfully resolved upwards marking the end of the prior downtrend. Even since it IPO, price has bounced between $13 and $23 and it seems like this cycle (this rectangular channel) will continue. Accordingly, I would place a stop loss at $14 and take profits at $23. SOFI recently cleared a regulatory hurdle to become a bank. The news seems to have given the stock a much-needed boost and we could soon see price at new ATHs.

$SOFI nice move so far!We pointed out this name as a long idea in the group live stream this morning!

Bank charter approved, go long $SOFISOFI has been successful in achieving a bank charter through the acquisition of California-based community lender Golden Pacific Bancorp.
It has been consolidating on the weekly chart for almost a whole year now. With the MACD curling up & histogram turning white heading towards green while the RSI is heading to test 50, I really like this set-up.
Some say it is priced in already. I highly doubt that. This stock could easily hit a $25 billion market cap (roughly the market cap of HBAN, which I say would be a reasonable comparison/achievable target since HBAN is a plain vanilla regional bank) with the combination of having a super app with the backbone of a bank charter. If it were to hit that market cap, SOFI would be trading at roughly $30.98. More than a double from here.
It seems to be the perfect time to go long. The combination of student loan management, IPO access, banking, crypto, stock trading, etc all in one app gives it a significant edge. If it can catch some momentum and pass $50, then it could be headed much higher.
An extremely bullish case would be SOFI reaching PYPL like numbers. SOFI's total assets increased from Sept 21 to Dec 21, while PYPL's decreased. On the day Dec 31st, 2021, PYPL had roughly 8.22x the assets of SOFI. Just throwing out a rough number, with net interest margins being added into the revenue basket for SOFI because of the bank charter and the potential to continue to increase its AUM and total assets then you could throw out a share price of $112.70 ($13.71 * 8.22).
Volume has been steadily increasing indicating increased interest and coverage. Oops. EBITDA somehow was from UCTT on the initial post and Tradingview won't let me edit it, no worries. Here is the chart with SOFI's EBITDA has shown some recent upward momentum.
This is just a theory, not financial advice, please do your own DD.

SoFi Technologies, Inc (NASDAQ: $SOFI)Social Finance, Inc., a finance company, operates an online platform that provides financial services. It offers student loan refinancing, private student loans, personal loans, auto loan refinance, home loans, mortgage loans, and investments, as well as insurance products for renters, homeowners, automobiles, and others. The company also offers SoFi Weekly Dividend ETF, an equity ETF to provide a weekly dividend payment to shareholders. Social Finance, Inc. was formerly known as Credit-Linked Community Notes of Social Finance Inc. The company was incorporated in 2011 and is based in San Francisco, California with additional office locations in Healdsburg, California; and New York, New York.

SOFI Good news stil below support. See a daily close or 2 above 15.08 the. You can try a long. As of now it’s still just hovering below long term support. This news cpuld pop it yes, but bette be safe then sorry. Otherwise stoplos below the low. I’ll wait for confirmed support above 15.10!!

$SOFISoFi Technologies, Inc. company announced that the OCC and the Federal Reserve approved its applications to become a Bank Holding Company through its proposed acquisition of Golden Pacific Bancorp and operate its bank subsidiary as SoFi Bank, National Assoc
Acquisition expected to close in February, Morgan Stanley Maintains Overweight price target 20, Rosenblatt Maintains Buy price target 28
SoFi Receives Regulatory Approval to Become a National Bank
SAN FRANCISCO, January 18, 2022--(BUSINESS WIRE)--SoFi Technologies, Inc. ("SoFi"), the digital personal finance company, today announced that the Office of the Comptroller of the Currency (OCC) and the Federal Reserve have approved its applications to become a Bank Holding Company through its proposed acquisition of Golden Pacific Bancorp, Inc., and operate its bank subsidiary as SoFi Bank, National Association. SoFi expects the acquisition to close in February, subject to completion or waiver of the remaining customary closing conditions.
"This incredible milestone elevates our ability to help even more people get their money right and realize their ambitions," said Anthony Noto, CEO of SoFi. "With a national bank charter, not only will we be able to lend at even more competitive interest rates and provide our members with high-yielding interest in checking and savings, it will also enhance our financial products and services to ensure they efficiently meet the needs of our members, business partners, and communities across the country, while continuing to uphold a high bar of regulatory standards and compliance. This important step allows us to add to our broad suite of financial products and services to better be there for our members during the major financial moments in their lives and all of the moments in between. I’m incredibly proud of our team and excited about the opportunities ahead to help even more people achieve financial independence."
Last year, in a key strategic step in SoFi’s path to obtaining a national bank charter, the company announced a definitive agreement by its subsidiary Social Finance, Inc. to acquire Golden Pacific Bancorp, Inc. (OTCPK: GPBI) and its wholly owned subsidiary Golden Pacific Bank, N.A. (together, "GPB"). SoFi plans to contribute $750 million in capital and pursue its national, digital business plan while maintaining GPB’s community bank business and footprint, including GPB’s current three physical branches. At the time of the announcement, SoFi submitted a revised business plan for GPB to the OCC and an application to become a bank holding company and for a change of control to the Federal Reserve for approval. After completing the acquisition of GPB, SoFi Technologies, Inc. (NASDAQ: SoFi) will become the parent company of SoFi Bank, National Association.
About SoFi
SoFi helps people achieve financial independence to realize their ambitions. Our products for borrowing, saving, spending, investing and protecting give our nearly three million members fast access to tools to get their money right. SoFi membership comes with the key essentials for getting ahead, including career advisors and connection to a thriving community of like-minded, ambitious people. SoFi is also the naming rights partner of SoFi Stadium, home of the Los Angeles Chargers and the Los Angeles Rams. For more information, visit SoFi.com or download our iOS and Android apps.

SOFI Becomes a National BankToday, SoFi Technologies ( NASDAQ:SOFI ) announced that the company received regulatory approval to become a National Bank. This is a massive achievement for SOFI. The Office of the Comptroller of the Currency (OCC) and the Federal Reserve have approved SOFI's applications to become a Bank Holding Company through its proposed acquisition of Golden Pacific Bancorp and operate its bank subsidiary as SoFi Bank , National Association.
SOFI expects the acquisition of Golden Pacific Bancorp to close in February 2022, subject to the remaining customary closing conditions.
“This incredible milestone elevates our ability to help even more people get their money right and realize their ambitions,” said Anthony Noto, CEO of SoFi. “With a national bank charter, not only will we be able to lend at even more competitive interest rates and provide our members with a high-yielding interest in checking and savings, but it will also enhance our financial products and services to ensure they efficiently meet the needs of our members, business partners, and communities across the country while continuing to uphold a high bar of regulatory standards and compliance. This important step allows us to add to our broad suite of financial products and services to better be there for our members during the major financial moments in their lives and all of the moments in between. I’m incredibly proud of our team and excited about the opportunities ahead to help even more people achieve financial independence.”
Last year, in a key strategic step in SoFi’s path to obtaining a national bank charter, the company announced a definitive agreement by its subsidiary Social Finance to acquire Golden Pacific Bancorp and its wholly-owned subsidiary Golden Pacific Bank. SoFi plans to contribute $750 million in capital and pursue its national, digital business plan while maintaining Golden Pacific Bank's community bank business and footprint, including Golden Pacific Bank's current three physical branches. At the time of the announcement, SoFi submitted a revised business plan for Golden Pacific Bank to the OCC and an application to become a bank holding company and for a change of control to the Federal Reserve for approval. After completing the acquisition of Golden Pacific Bank, SoFi Technologies will become the parent company of SoFi Bank, National Association.
Over the past year, SOFI investors have been hit left, right, and center holding onto this highly volatile stock. In fact, the stock has continued to move towards all-time lows day after day. That being said, fundamentally, the business continues to perform very well. SOFI's guidance for Q4 2021 points towards SoFi reigniting revenue growth rates to 55% yr/yr growth. This gives investors reassurance during this turbulent time that SOFI is indeed still growing rapidly.
Right now, with SOFI's National Bank approval, this fintech stock's risk-reward profile is arguably the best it's ever been.

Playing Sofi long here! Picked up a nice size position based on December 28,2020 candle wick high of $13.04. I've got another buy set for December 22,2020 high of $12.14. Doesn't look like it will get there, but I'm prepared.
Now I'm looking for a move to $13.93 this week and then $17.15 this month.
I like the fundamentals of sofi. With higher interest rates, pending bank charter approval, year over year growth, and super bowl LVI this year; it has potential.
Long on Sofi and the new developing neobank eco system.

$SOFI - Support broke. What's next?Failed to bounce from the long term support trendline and the price has broken down below it. Important support areas are $13 and $11.45.
If $13 support is critical psychological support area.
As of now Oscillators are not turning up yet. So it's a period of indecision with a little weight on the down side.
The cheaper the company gets the more likely it is to become an acquisition target. So anything is possible.
I am watching for an opportunity to load more.
———————————————————
How to read my charts?
- Matching color trend lines shows the pattern. Sometimes a chart can have multiple patterns. Each pattern will have matching color trend lines.
- The yellow horizontal lines shows support and resistance areas.
- Fib lines also shows support and resistance areas.
- The dotted white lines shows price projection for breakout or breakdown target.
Disclaimer: Do your own DD. Not an investment advice.

SoFi (NASDAQ: $SOFI) Looking Mega-Opportunistic Under 0.786! 👀Social Finance, Inc., a finance company, operates an online platform that provides financial services. It offers student loan refinancing, private student loans, personal loans, auto loan refinance, home loans, mortgage loans, and investments, as well as insurance products for renters, homeowners, automobiles, and others. The company also offers SoFi Weekly Dividend ETF, an equity ETF to provide a weekly dividend payment to shareholders. Social Finance, Inc. was formerly known as Credit-Linked Community Notes of Social Finance Inc. The company was incorporated in 2011 and is based in San Francisco, California with additional office locations in Healdsburg, California; and New York, New York.
