SOFI boxes strategy in action! feat. volume profileHi everyone!
Today we are analyzing NASDAQ:SOFI price movement.
As always, I am using my boxes strategy based on supply and demand.
BUT
In addition, I used volume profile for detailed context here.
A few words on volume profile:
It puts trade volume on vertical axes. So instead of volume per point in time metric, we observe volume per point in price . This way we can see at which price point the highest amount of volume had occured.
Let's implement it on our NASDAQ:SOFI chart.
Since February 2021 the highest volume has occured in 15.1 - 15.8 price range.
Red horizontal line at 15.45 is called Point of Control (POC). It is a highest volume node that has seen the most volume. Thus, that is a significant level of support/resistence.
Believe it or not, but I drew trendlines, boxes and indicated levels first. Only then I added Volume Profile starting from February, and its POC at 15.5 matched one of my box levels.
What does it tell us?
Two indicators confirm that 15.5 is a significant level.
We are at 19.3 now in a downward long-term trend near its top.
Plan:
Look for a return to 15.5 zone in order to start a position.
Probably better to open a position earlier at 16 to front-run algos.
If decent volume at 18 level occurs and it holds, start a position there.
Please let me know if this was helpful and if you want to see more analysis with volume profile.
Trade wisely and good luck!
-----------------------------------------------------------------------------------------------------------------
Disclaimer!!!
This is not financial advise.
SOFI trade ideas

SOFI daily ChartSofi has been following the pitchfork and fib retracement well and has ended today in a hammer. If this trend continues, watch the intersection of the .65/.618 fibs and the next pitchfork resistance as PT.
Bank charter information is expected to come out end of this month and the next earnings call is not far away either.

SOFI Tapped long term resiatnce today. Like she breakout ? Yes. Are probabilities higher that after a monster run like that it will need to cool off and mostlikely get rejected ? Yes…. I’d short

SOFIHOT zone // SOFI strong streak. RSI pulling back/another test of 18 is possible. $25 price target short to mid term.
(overweight) + ( long contracts JAN $17.50 (itm))

SOFI finally getting some loveSOFI is an absolute beast that has been undervalued for too long. Analysts coming out with price targets now are a joke. Where were you when this was at $14? Anyway, technicals are looking strong, broke through resistance, massive bullish candles, great volume.$19.78 is the next level to watch. It's lights out if we break above $20.50.

SOFI Bullish Scenario I believe that if SOFI is able to cross the 50 fib level and close above it, then it will not have a hard time running to the next point of resistance. which is the trendline displayed

SOFI TECHNOLOGIESMorgan Stanley has recently upgraded the price target to $25 and are expecting it to grow 150% over the next 2 years. Strong earnings are also expected which will be published this week. I have taken the trend by using the simple Dow theory.

SOFI - Break out the long rectangle SOFI - Broke out the long rectangle
-- Huge volume
-- Next target 19.77

just be patient with Sofi it's a new companyso sofi is a new company but a good company im bullish long term and will buy every dip i imagine well see one more dip down on the chart to retest and then it's gone for some highs around christmas. every stock in the market does not have to be bad even if the economy is doing shitty! remember as far as the economy goes were still just back to July 2021 and could be a bull run ahead. red zone is the buy area and yellow is the same resistance were seeing the sellers come in around $17.10-$17.32 and i advise taking profits than as well and waiting for the break out confirmation.

$SOFI plan for this weeksolid orange are intraday actionable plays
dotted are take profit targets
Harmonic pts are for longer dated positions

Rolling (IRA): SOFI October 15th 20 to November 17.5 Short Calls... for a 1.02/contract credit.
Comments: With only .13 left in the 20's, rolling the short call aspect of my covered calls down to the November 17.5's for a 1.02/contract credit, with a resulting cost basis of 15.76 (See Post Below) - 1.02 or 14.74/share and a max profit potential of the short call strikes (17.5) minus 14.74 or ($276) per contract.


SOFISOFI Stock looks Bullish
Huge Volume coming in
Good Risk to reward
Great Company Fundamentals to disrupt the fintech Sspace
Sector rotation into SPACS on Nasdaq = RISK ON

SOFI - looks strongSOFI got an upgrade from Jefferies to $25
Broke strong resistance at 17, cleaned the level and now is looking to move higher
There is no strong resistance to 25
Volume 22M is high enough to keep the stock moving up
Market is favorable to growth stocks at the moment

SOFI - Good Long term Stock HereWeekly chart trading within symmetrical triangle and wave D. Weekly bullish engulfing showing continuation into next week. I like initiating a 1/5 position here with a max 5% allocation.
Entry 1: $17.64 (1/5th position of the 5% allocation)
Entry 2: $15.71 (adding another 1/5th position of the 5% allocation) - 2/5 invested
Entry 3: 14.62 (adding another 1/5th position of the 5% allocation) - 3/5 invested
PT: $40.35 - $44.93 for Wave 3 as long as wave 2 low is not breached ($13.14)
SL: $10

Closing (IRA): SOFI October 15th 15 Short Puts... for a .23/contract debit.
Comments: Opened at-the-money for 1.76 (See Post Below), taking 1.53 ($153)/contract's worth of profits here, freeing up the buying power for another shot lower should earnings disappoint. Still have the October 15th 20 Covered Calls on, where I'm waiting to roll the 20's out on approaching worthless ... (or to take profit should we have a decisive move above 20; unlikely, but we can dream).

SOFI1. Testing support?
2. Price respects historical pattern?
3. Flag down needs to finish?
I like this setup. I want to see bullish candles at support. Once price rejects support, I want to see whether or not price will break through my trend line for a move towards the upsiide.

$SOFI looking for a breakout soon?What do you guys think?
$SOFI - great fundamentals and lots of potential in the business.

SOFI Straight up, straight down.SOFI - Beautiful Daily chart here. Got some clear Bullish divergence on the MACD and the RSI at the bottom of the range and put in a couple higher lows. Above here, the target is 24$. You may have some profit takers at 19.82, and 21, but looking at historical price action correllation between the top and the bottom of the zone, its straight up, straight down, every time.
We are off the entry (13.94) but still an equitable 3:1 trade no matter which target you're looking for. I increased the stop for the larger targets to give some cushion, but i dont think its neccessary personally.

SOFI - Long Period of Consolidation - Breakout Imminent sofi
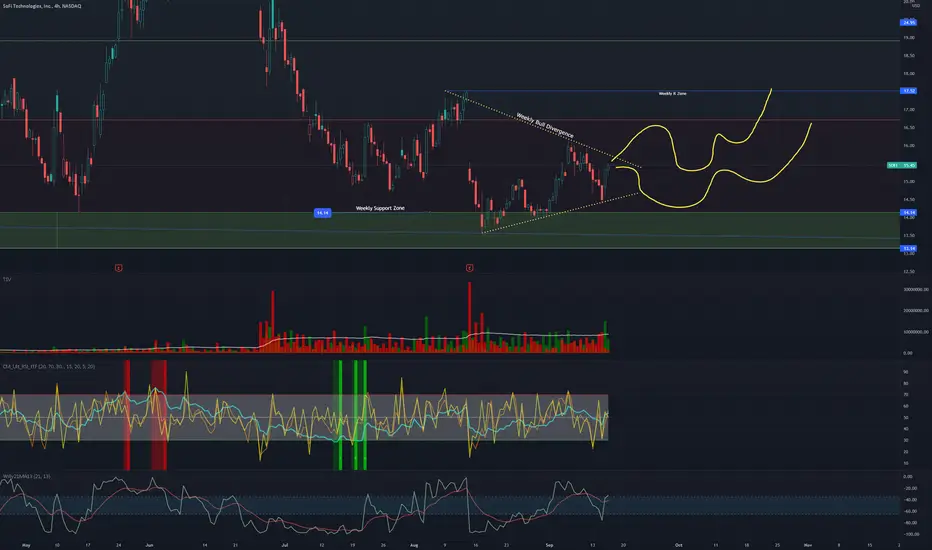
SOFI - a lot of momentum in the business with a bank charter around the corner, new president, football stadium, and more. This stock looks ready for a significant move to the upside. I could potentially see one wave lower to the green demand box, but with the 4hr divergence, decided to go ahead and jump in. Long shares of SOFI.
Target $40+

SOFI BreakoutSofi has made higher lows since it gapped down in August and is trading just bellow the POC line (ytd).
The RSI is still low around 53 and the most recent daily candle closed above the .38 fibonacci level. The 9ema crossed the 20ema and the most recent candle closed above the descending trend lines.
I anticipate some resistance at $15.56
targeting: $16.70, $17.56, $20.03

Wowzer perfect harmony $37 TPa text book Butterfly pattern is forming this is an amazing opportunity to buy in low

SOFI Winding and Compressing for the Break and Run!Update on SOFI.
Cooking and preparing for a Run.
Very short Reversal on the 4 Hour.
Namaste Traders.