$SOFI Have you seen Rising Three Methods candles?NASDAQ:SOFI Rejoice, folks! We’ve got a Rising Three Methods pattern from last week. 🚀 There’s a strong chance we’ll see the price push above the $8 level. Check out the price targets I posted on August 18.
As always, I share my opinions and trades. I’m not suggesting anyone follow my trades. You do you.
SOFI trade ideas

Three rising methods on SOFISOFI fell to test old resistance level as support. While it did put in a lower low after the higher high SOFI is now back out of the previous channel showing a bullish three rising methods candle pattern.

SOFI: Hot TakePeople are betting Sofi goes positive after FED drops rates. First off, the technicals show the stock doesn't look ready to fly yet.
1) They MAY not start in September. Everyone sells if that's the case.
2) IF they begin in September. The pace in which the FED drops rates is typically slow. .25bps to start is not going to be enough to make any significant positive moves in the stock price. I believe it will be a sell on the news event seeing as we're pricing in the benefit of a rate cut already.
Short term, I believe we remain on on trend, or down and to the right 📉
It's just a bank.

Critical Week For SOFIThank you for your time.
SOFI on weekly TF.
SOFI has appeared to have formed a double bottom if it breaks this neckline, it may move higher.
This neckline is also next to the 50 EMA and to resistance of the Symmetrical triangle.
SOFI also have healthy RSI and SRIS levels.

$SOFI - Looking good for a bullish reversalNASDAQ:SOFI SoFi has the potential for a bullish trend reversal. It’s trading within a wedge and is approaching a major resistance level. I believe it will break out above that resistance this time around.
Targets:
$7.90
$8.56
$9.20
$10.50
Support:
$6
As always, I share my opinions and trades. I’m not suggesting anyone follow my trades. You do you.

$SOFI | Allocation | Market Exec |Technical Confluences:
- Price action has bounced off a 78% Fibo retracement
- Below the 78% Fibo retracement is also been a Demand Zone which breaking it would like lead to a new all time low
- For price action to move up higher, it needs to break above the Interest Zone (@ 61% Fibo) and also the resistance trendline
- Upon breaking that, it's next resistance would be the Supply Zone area above
Fundamental Confluences:
- SoFi has shown impressive revenue growth but struggled with profitability, posting net losses due to high operating expenses and investments in growth.
- The path to profitability is improving as the company scales and focuses on higher-margin products, but consistent positive earnings have yet to be realized.
- They have historically reported negative FCF but recent quarters have shown improvements. The company’s ability to generate positive FCF will be critical to sustaining its growth without needing to rely on external financing.
-----
I have previously allocated to NASDAQ:SOFI before as I feel this company is a high-growth potential with promising narrative as explained above.
Will be happy to add if there is again a dip in the price.
-----

SofiGreen = Yearly levels
Pink = Monthly levels
grey = Weekly
Red= Daily
Orange = 4
The higher timeframe levels are the strongest and our expectation is a strong bounce. if that strong reaction is not seen, and the level is disrespected, then the opposite is true.
use if/then statements to guide your thinking.

RajeevAaamwalA 200-period SMA is used to determine the long term trend. A 50-period SMA is used to determine the intermediate trend. A 5, 10, or 20-period SMA are used to determine the shorter-term trend.

SOFI: One The Move!SOFI has been on tight consolidations for a long time. It's starting to make a move.


SoFi technologies (SOFI)Falling Wedge worked like a charm. Found support at the 50-day SMA. Making second attempt at the 200-day SMA. Holding this level will force professional capital into the name. Some risk at this point for a double top reversal. Still long. Still bullish.

Very Bullish on SOFIHeavily bullish on SOFI going into earnings next week. Soft landing is all but guaranteed at this point and talks of a rate cut, maybe even 2, have been ramping up possibly up to 50 basis points. Bank stocks **should** benefit from this and hope to at least double my money on this options trade. Will be holding shares for foreseeable future and buying more if earnings come in below expectations.

$SOFI - Be patientNASDAQ:SOFI posted a great quarter and guidance. I like the chart setup. This will finally break the $8 to $8.20 resistance, going to $9.10 and eventually to the $12 area. Targets from previous posts remain unchanged. 👀🚀
It is a broken stock not a broken business.

SOFI Technologies Options Ahead of EarningsAnalyzing the options chain and the chart patterns of SOFI Technologies prior to the earnings report this week,
I would consider purchasing the 7usd strike price Calls with
an expiration date of 2024-8-2,
for a premium of approximately $0.72.
If these options prove to be profitable prior to the earnings release, I would sell at least half of them.

$SOFI - Can we do it this time?NASDAQ:SOFI A breakout above $9.10 (resistance #2) confirms the wedge breakout, with a measured move targeting $12. However, it needs to overcome the $8 to $8.20 hard resistance area first.
ER is on Tuesday. 🙏🚀
I had a wrong chart in my previous post. Here is the correct chart.

$SOFI - Can we consolidate here?NASDAQ:SOFI I closed my 9/20 calls for a 115% profit during the morning run-up.
The stock was rejected from the $8 resistance area and closed below the 200DMA and VWAP. It is currently supported by the POC area of the volume profile.
RSI exited overbought territory. As long as it holds above the POC and reclaims the 200DMA, it can consolidate here before making the next leg up.
Watch $7.25 area for a pivot.👀

$SOFIreclaiming 200 ema about to reclaim previous range low
targeting white line above likely to deviate above that and will reassess what to do there IF and when we get there
invalid with acceptance back below 200
or a daily close below it.

$SOFI - Still have room to run NASDAQ:SOFI The past three bull runs saw Sofi's stock price increase by 91%, 129%, and 64%.
My target of $9 is less than a 50% increase for this bull run. If this bull run lasts for a 100% increase, the stock price could reach $12 to $12.50, which aligns with the measured move of the outer wedge's breakout.
Although the RSI has entered the overbought territory, the MACD just crossed the zero line, indicating it still has room to run.
Also, the fact that Sofi closed above the VWAP and 200DMA combined resistance is a big help with the momentum.
Shorts have not yet covered in force. In fact, some may have doubled down during this run-up, as shown by the bottom red bars in the chart. This suggests there is fuel to light the fire when a positive catalyst emerges. 🚀💰

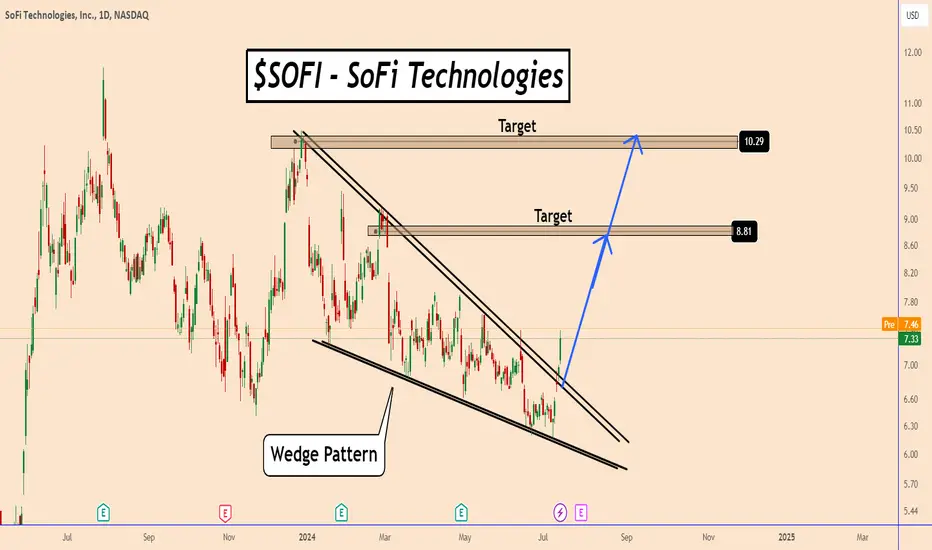
SOFI: Bullish Wedge pattern indicating further upsideSOFI: Bullish Wedge pattern indicating further upside
Price broke out from a bullish wedge pattern and this is indicating further upside.
During the previous quarters SOFI reported very good data.
Earnings Report is on 30 July 2024 and as I see the market is moving ahead of the data in order to anticipate the good numbers.
We can see SOFI to reach 8.80 and 10.2 price areas easily.
All details on the chart.
Thank you and Good Luck!
SoFi Technologies (SOFI)Possibly breaking out form a Falling Wedge pattern of bullish reversal. Long the name. Short-term Target: $8.75, add down to 21-day EMA, panic on a new post June low.

$SOFI break Out Monday and close over $9 by end of the weekIf it can get past resistance at $7.40 on Monday, move past $7.94 swing level, could be a clear path to fill the gap at $8.57 and probably won't bump its head until $9.18.

Sofi presses momentumSOFI once again presses the momentum trend on the inflation news, a small rally into earnings. My 11.14$ price target for end of year remains but I would be happy to see higher of course. I currently only own 2026 LEAPs at 7$ strike which are very capital efficient. My plan is to sell calls against these if the stock can push 8$+.
-Will earnings impress?

$SOFI - It will have to decide soonNASDAQ:SOFI Since the beginning of the descending wedge, the volume and price volatility have been steadily decreasing, which is a sign that selling pressure is easing.
It will have to decide soon. 👀🚀
