SRTS (NASDAQ) - 30-Min Chart Long Trade Setup !🔥 🚀
🔍 Stock: SRTS (NASDAQ)
⏳ Timeframe: 30-Min Chart
📈 Setup Type: Bullish Reversal & Breakout
📍 Trade Plan:
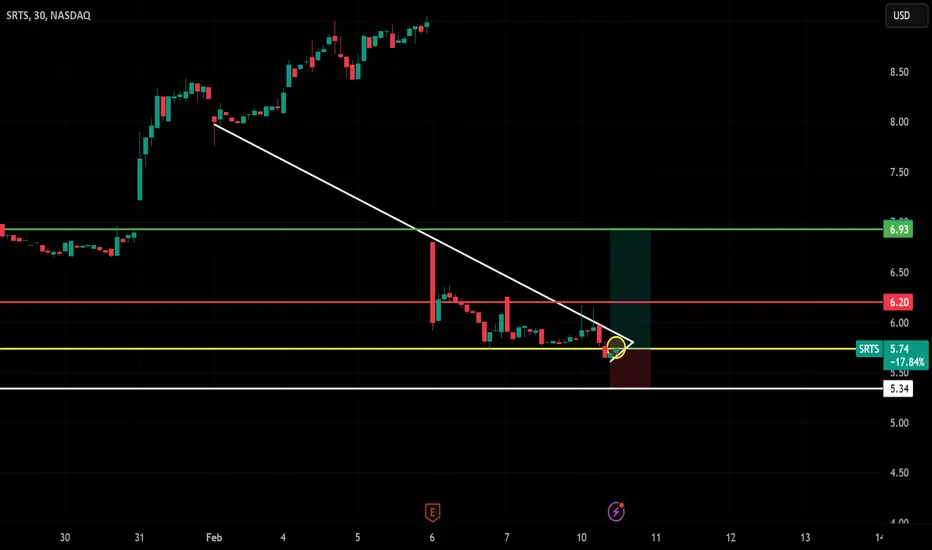
✅ Entry Zone: Above $5.74 - $6.20 (Breakout Confirmation)
🟢 Take Profit 1 (TP1): $6.20 (First Resistance Target)
🟢 Take Profit 2 (TP2): $6.93 (Extended Bullish Target)
🚀 Stop-Loss (SL): Below $5.34 (Key Support)
📊 Risk-Reward Ratio: Favorable for a bullish continuation 🚀
🔹 Technical Analysis & Setup:
✅ Pattern: Descending Triangle Breakout 📈
✅ Breakout Confirmation Needed: Sustained price above $5.74 with volume increase
✅ Support & Resistance Levels:
🔸 $5.74 (Breakout Zone)
🔸 $6.20 (First Major Resistance)
🔸 $6.93 (Extended Target for strong momentum)
✅ Momentum Shift Expected: A breakout above $5.74 could trigger an upside rally 🚀
🔥 Trade Strategy & Refinements:
📊 Volume Confirmation: Look for increasing buying volume above $5.74 📈
📈 Trailing Stop Strategy: Once price reaches TP1 ($6.20), adjust SL higher to secure profits 🛑
💰 Partial Profit Booking: Take partial profits at $6.20 and let the rest ride toward $6.93+ 💵
⚠️ Fake Breakout Risk: If the price fails to hold above $5.74, reconsider entry ❌
🚀 Final Thoughts:
✅ Bullish Reversal Potential – Strong bounce from support 📈
✅ Momentum Shift Possible – A move above $6.20 could accelerate upside 🚀
✅ Strong Risk-Reward Setup – SL at $5.34, TP at $6.20 - $6.93+ for optimal gains
📊 Trade Smart & Stick to the Plan! 🏆🔥
🔗 #StockMarket #SRTS #TradingSetup #TechnicalAnalysis #BreakoutTrade #DayTrading #MarketTrends #BullishSetup #ProfittoPath 🚀📈
SRTS trade ideas
SRTS - Long SetupNASDAQ:SRTS
Charts are self-explanatory. Levels of breakout, possible up-moves (where stock may find resistances) and support (close below which, setup will be invalidated) are clearly defined.

Ouch - SRTS down 50% on Earnings Miss.Another stock heavily punished for missing expectations. Over reaction? Will have to wait and see.

RESISTANCE TESTInteresting test of March highs while DMI is signaling a potential bullish pressure is
yet to be ended, we expect here some volatility due to profit takings of shorter term traders, however until the middle of the range is below prices we could wait for a weekly close above the resistance in order to trigger our longs over a bullish breakout momentum strategy.

Long position with 48% profit / 7,20% loss potential The stock price of Sensus Healthcare (SRTS) is currently relative low compaired to the average price of 14,30 per share. Within a couple of weeks I predict a profit of max. 48% with a potential risk of 7% of the stock price.
Let's see within a couple of weeks!

Sensus Healthcare Announces Share Repurchase Program!!!SRTS: Sensus Healthcare, Inc.
2022-03-09 08:00:00
Sensus Healthcare Announces Share Repurchase Program

US Stock In Play: $SRTS$SRTS cleared a one year base cleanly with a high tight flag consolidation right now. breakout level at $8.55 will be 52 weeks high.
YoY
Q3 EPS + 110%
Q3 Sales + 241%

Sensus Healthcare is likely to move up. SRTSNot likely a start of a major impulse, but we will see. Fractally looking to move up on this one.
We are not in the business of getting every prediction right, no one ever does and that is not the aim of the game. The Fibonacci targets are highlighted in green with invalidation in red. Fibonacci goals, it is prudent to suggest, are nothing more than mere fractally evident and therefore statistically likely levels that the market will go to. Having said that, the market will always do what it wants and always has a mind of its own. Therefore, none of this is financial advice, so do your own research and rely only on your own analysis. Trading is a true one man sport. Good luck out there and stay safe!


Holy Name Medical Center in Teaneck, New Jersey Acquires Sensus SRTS: Sensus Healthcare, Inc.
2021-01-06 09:32:22
Holy Name Medical Center in Teaneck, New Jersey Acquires Sensus Healthcare’s Low-dose Radiation Therapy System to Treat Pneumonia in COVID-19 Patients

SRTS - Insane Consolidation - Big Move Up or Down?All,
Think SRTS could make a big move soon. Honestly, with overall market trends and this stock in general. Hard to really say if it's a move up. But man is that some serious consolidating at the bottom. Will update later prob next week.

Yet Another TriangleMan, these setups are just so fun to trade.
NASDAQ:SRTS approaching a breakout, be wary!
