7/23/25 - $ssnc - Interesting, i'd dip buy it7/23/25 :: VROCKSTAR :: NASDAQ:SSNC
Interesting, i'd dip buy it
- 5% fcf yield
- ez does it top line growth, nothing stellar MSD
- mid teens PE
- software-esque ebitda mgns
- nothing that i know well and it's HC, so honestly the fact it's bid, doesn't run similar risks as insurers but ultimately (as my pea brain understands it) is probably a net +ve on MLR stuffs
- if this thing has any relevant dip on emotional w/e e.g. BOATS:FI this morning, it might be a solid dip buy, but i'd require probably mid to low 70s to be interested.
- that being said, stock will probs work/ continue to go up and i'd even expect a green reaction hence the "buy" even tho i'm not buying it here
V
SSNC trade ideas

Why SSNC technologies is bullishAbout 45 trillions of assets are run on the technology provided by SS & C company. Its financial services and health operations have received good feedback from its clients. The principal aspect of this company’s strategy is organic growth and scaling through acquisition which is a double edge sword for a software company as such.
So why are we bullish about SS & C
(1) It is trading below its intrinsic value: The conditions that led to the drop of its stock price from its high in Jan 2022 are beginning to wane. So since the fundamentals of the company are still consistent, we expect either a total reversal to it's all time high or a retest of its preview low after a short term rise in the price before taking its all time high.
(2) A bullish potential pivot area (ppa) spotted: Based on our stock price model, a swing is imminent. It is expected that the swing falls within the stop loss area from the chart above.
(3) A bullish Elliot wave outlook:
From the snapshot above we can see that we are currently in a corrective structure after the 12345 impulse was over. We are expecting the abc correction to end soon and the next wave to commence if the correction does not become complex.
(4) A bullish XABCD pattern has been identify:
From the image above we can see that the D wave is about to be completed for the bull run
(5) The Bollinger bounce and the overbought stochastics:
The Bollinger band indicator is very helpful in ranging markets like this one, we can see from the snapshot above that the price is already hitting the lower band. We are expecting a bounce towards the middle line of the indicator.
The stochastics is already oversold, so we may see a reversal soon, just like it happened at other points in the snapshot.
We would love to hear your views and questions in the comment section below. Thank you for following along.
The Nedium Team

Possible swing hi @ $79ish & short to $63I dowse stocks and my pendulum picked this stock a week ago. It got an upgrade Friday and was up a lot. I have an upper target around $79 and the guidance is that it goes back down to around $63.
It could be completely wrong, of course, but I do expect indexes lower, so we'll see. There's also some heavy options on the put side, but is maybe just a hedge. I've got a number of readings to journal on here and see how they shake out, so this is mostly for my own record fyi.

$SSNC with a bullish outlook following its earnings #StocksThe PEAD projected a bullish outlook for $SSNC after a positive under reaction following its earnings release placing the stock in drift A with an expected accuracy of 100%.

$SSNC with a Bullish outlook following its earnings #Stocks The PEAD projected a Bullish outlook for $SSNC after a Negative over reaction following its earnings release placing the stock in drift C with an expected accuracy of 50%.

SSNC is one to keep an eye on!* Excellent earnings and accelerating
* Very strong up trend since inception
* High 3-month relative strength in the Tech sector
* Breaking out of a ~5 month base creating a cup and handle pattern
* Depth of the cup is ~15.5%
* Breaking out with higher than 15 day average volume
Trade Idea:
* Given the current market conditions you can open a small position with a hard stop.
* Also, given the market conditions, I wouldn't be surprised if this comes down to $78.55 area
* If you're not entering now, this stock is one to keep on your watchlist for when you do decide to jump in.

Selecting the best of the best of the Russell 2000This one i like for a medium trade. Cup and handle formed with up trend on price action, MACD, and RSI. This looks bullish

fundamental analysis (SSNC)Limit buy - 70,5$
Target - 76,78
Risk/Reward Ratio - 3,06
Stop-loss - 68,05


SS&C TECHNOLOGIES HOLDINGS Course DailyHello traders, SS&C TECHNOLOGIES HOLDINGS is in a configuration of bullish continuity, low buying volume and we see that the 4 sessions before there are sales volumes greater than the last. SS&C TECHNOLOGIES HOLDINGS has a great potential to seek its last precedent higher, maybe even the 2nd higher than, if the buyers have taste for the risk.
Please LIKE & FOLLOW, thank you!

SS&C Technologies Releases Q2 2020 Earnings, Announces Renewal aSSNC: SS&C
2020-07-28 16:05:00
SS&C Technologies Releases Q2 2020 Earnings, Announces Renewal and Increase of Common Stock Repurchase Program for $750 million

SS&C Technologies Holdings, Inc. Buy in dipSS&C Technologies Holdings, Inc.
www.ssctech.com
SSNC services to financial services and healthcare industries.
Market cap: 14.76B
Sales: 4.63B
EPS Growth this year: 291.90%
finviz.com

consolidating with volumeSS&C Technologies Holdings, Inc. engages in the development and provision of software solutions to the financial services and healthcare industries. good fundamentals.
SSNC is consolidating with volume; might be a nice setup for next Monday.


Tech For Finance: SS&C Technologies (SSNC) - Past Res Future SupSSNC is a software company for financial companies with a good balance sheet. It did not beat its recent earnings estimates; however, despite this event, the company still looks poised for more growth. Regardless of whether it beats expectations next quarter, this company is still stable financially and the long-term, technical, trend is there. The recent fall from its highs from $67ish to $54ish was met with institutional buying at previous levels of support.
Given the recent macroeconomic thrust of the company, the long-term trend and the technical picture of "Past Resistance; Future Support," I believe that the stock has room for a burst up to $80 or $100 in the coming months ahead; hopefully, by the end of 2019.

SSNC LongI use this feature to track/journal my trades and write notes about them...follow at own risk.
Not my favorite trade here, I see a bullish flag and bought on breakout, however now pulling back. Stop just under $48.00.
Profit at fib extension 1 or earlier if I see RSI divergence from previous highs.

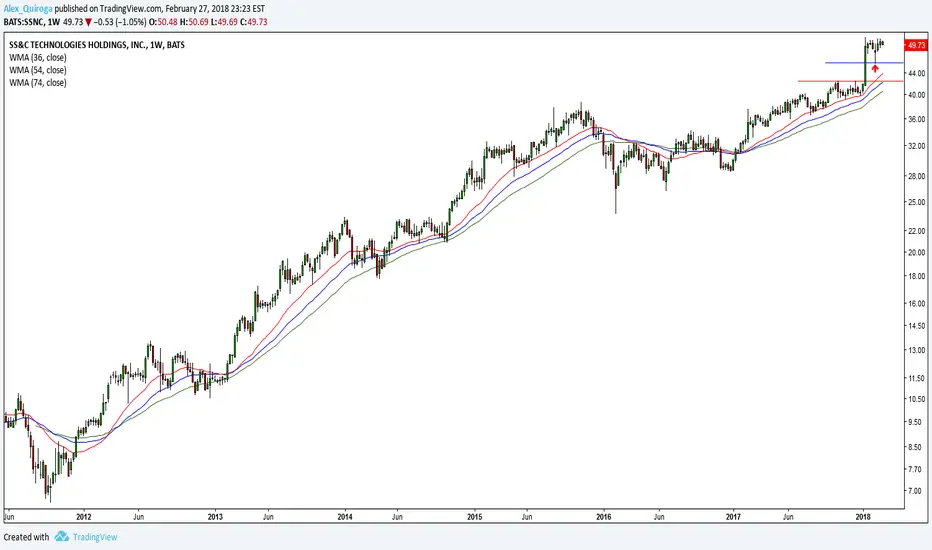
Technology stocks for 2018 #17 (SSNC)Sector: Technology
Industry: Business Software & Services
(Blue line) is Support
(Red line) is Resistance
direct your attention 2018-01-08
Look a big green weekly candle closing above the resistance (Red line) in 42.40
(Red arrow) long lower shadow testing the new Support (Blue line)
This idea need some weeks
why?
because I use the moving averages in a discretionary way
I use this norm:
If the price is too far of my (Red Moving Average)
then I need to wait some kind of approached between the price and the (Red Moving Average) either a deep pullback or a price consolidation between 46.00 and 50.00
Do you know that the price show a behavior with regard to Moving Averages and that the interpretation of this behavior is discretionary or qualitative.
For those reasons my interpretation and opinion may be different from that of another individual who is observing the same stock chart.
Technical Analysis It is not scientifically proven