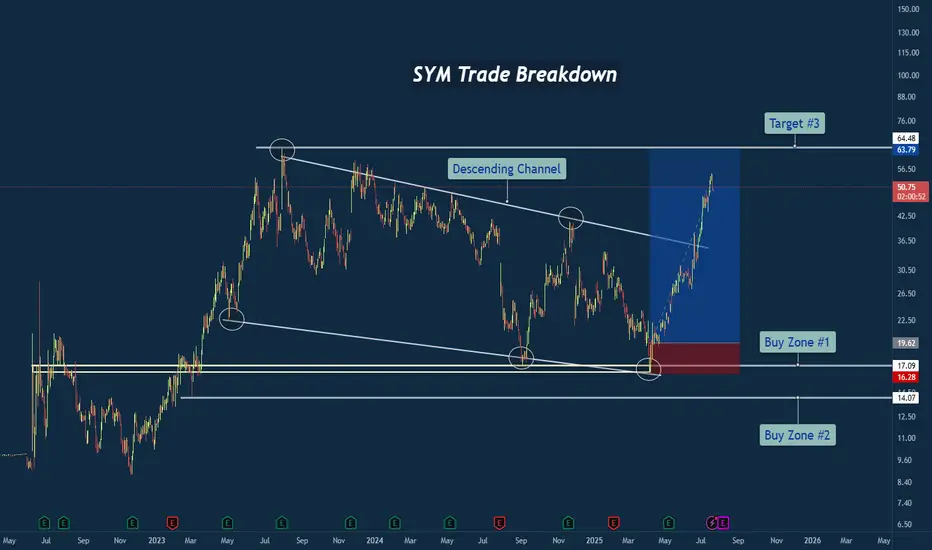
SYM Trade Breakdown – Robotics Meets Smart Technical's🧪 Company: Symbotic Inc. ( NASDAQ:SYM )
🗓️ Entry: April–May 2025
🧠 Trade Type: Swing / Breakout Reversal
🎯 Entry Zone: $16.28–$17.09
⛔ Stop Loss: Below $14.00
🎯 Target Zone: $50–$64+
📈 Status: Strong Rally in Motion
📊 Why This Trade Setup Stood Out
✅ Macro Falling Wedge Reversal
After nearly two ye
Next report date
—
Report period
—
EPS estimate
—
Revenue estimate
—
−0.07 USD
−13.49 M USD
1.79 B USD
43.85 M
About Symbotic Inc.
Sector
Industry
CEO
Richard B. Cohen
Website
Headquarters
Wilmington
Founded
2020
FIGI
BBG00Z72HCV1
Symbotic, Inc. is an automation technology company, which engages in a robotics and automation-based product movement technology platform. It focuses on developing, commercializing, and deploying innovative, end-to-end technology solutions for supply chain operations. It operates through the United States and Canada geographical segments. The company was founded by Richard B. Cohen on December 11, 2020 and is headquartered in Wilmington, MA.
Related stocks
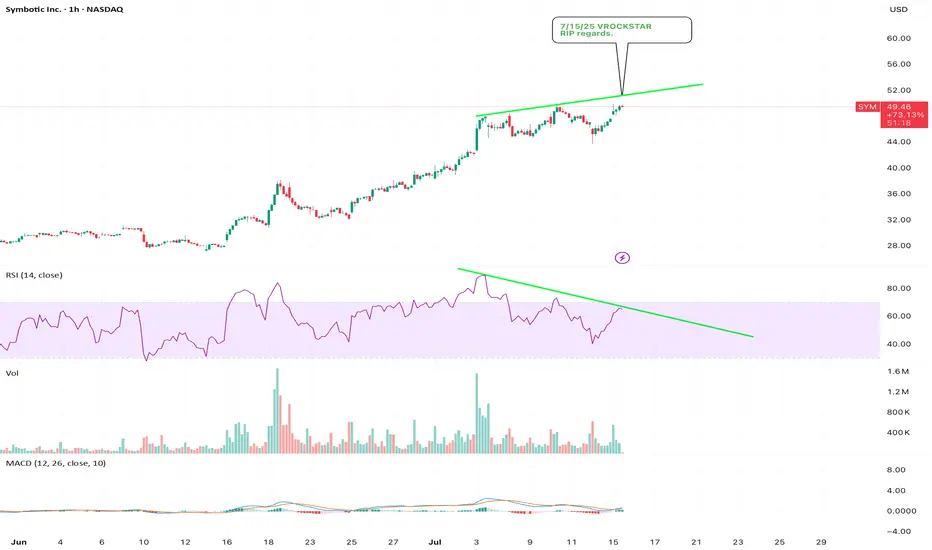
7/15/25 - $sym - RIP regards.7/15/25 :: VROCKSTAR :: NASDAQ:SYM
RIP regards.
- sizing this up
- muh robots
- but didn't do muh work
- hedge
- but seeing that -6% open on monday told me how incredibly fragile this structure is
- might head higher idk idc. one of my 10 hedges rn. you guys know
- pltr
- cvna
- qubt
- sym
- ura
7/3/25 - $sym - Crackhead central7/3/25 :: VROCKSTAR :: NASDAQ:SYM
Crackhead central
- it's almost laughable that i'm hedging my "risky" BTC, NXT, GAMB and OSCR/HIMS positions with
- the most crackheaded stocks, QUBT, now SYM, CVNA
- i'm really not sure if the chart bros will win this one
- but given the risk/ reward merits ste

Ready for a comeback!This is a company that produces autonomous robots for warehouses, capable of handling goods storage using AI—the potential of this idea is insane!
At the moment, it's automating all of Walmart’s warehouses, which is its main client.
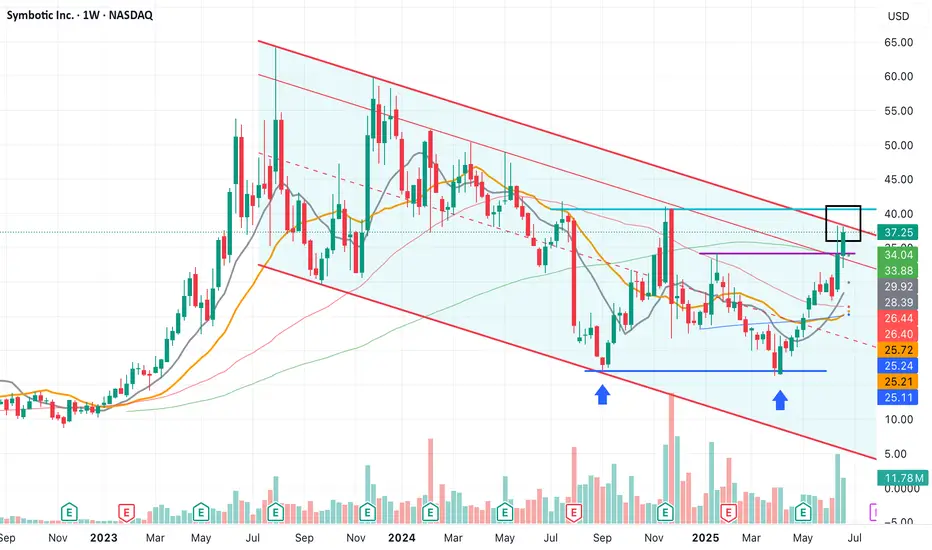
The price has been moving within a descending channel for two yea
6/18/25 - $sym - The warning signs are everywhere6/18/25 :: VROCKSTAR :: NASDAQ:SYM
The warning signs are everywhere
- what will powell do? who tf cares. buy bitcoin and chill.
- but the warning signs are everywhere in regard to how much money is floating around in this tape that needs to have a coming to reality check moment
- i have written a

Symbotic Inc. (SYM) Grows With AI-Powered RoboticsSymbotic Inc. (SYM) is a leading provider of AI-powered robotics and automation systems for warehouses and distribution centers. Its advanced technology helps retailers and wholesalers improve efficiency, speed, and accuracy in inventory management and order fulfillment. The company’s growth is driv
Breakout confirmed The price confirms last week's breakout, closing above the purple trendline.
The $17 area could also form a double bottom, but it is necessary to wait for the price to reach the neckline (around $40) to confirm it.
At the moment, the price is heading towards $34, where the weekly SMA100 (green lin

SYM formed double bottom SYM formed Double bottom pattern
Company Profile
Name: Symbotic Inc.
Ticker: SYM
Exchange: NASDAQ
Sector: Technology
Industry: Robotics / AI / Supply Chain Automation
Headquarters: Wilmington, Massachusetts, USA
Business Model: Provides AI-enabled robotics systems that automate warehouse oper

$SYM Long term hold and bullish outlook 6 months 🤖 Strategic Expansion with Walmart
In January 2025, Symbotic completed the acquisition of Walmart's Advanced Systems and Robotics business for $200 million, with potential additional payments of up to $350 million based on future orders. This acquisition is part of a broader $520 million agreement w

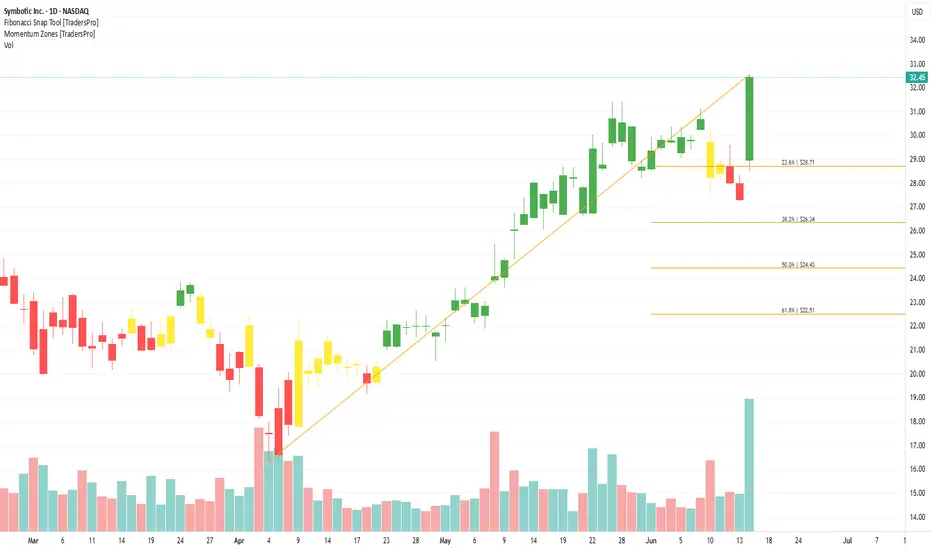
Symbotic Inc. (SYM) Bullish Opportunity – Growth & Momentum Play🔹 Current Price: $21.65
✅ TP1: $24.50 – Short-term bounce from support
✅ TP2: $30.00 – Key previous resistance level
✅ TP3: $40.00 – Next major resistance level ( long-term )
🔹Stop Loss: If trading with leverage, consider a stop below $18-$19.
🔥 Why Are We Bullish?
✅ Strong Revenue Growth
35% YoY

See all ideas
Summarizing what the indicators are suggesting.
Neutral
SellBuy
Strong sellStrong buy
Strong sellSellNeutralBuyStrong buy
Neutral
SellBuy
Strong sellStrong buy
Strong sellSellNeutralBuyStrong buy
Neutral
SellBuy
Strong sellStrong buy
Strong sellSellNeutralBuyStrong buy
An aggregate view of professional's ratings.
Neutral
SellBuy
Strong sellStrong buy
Strong sellSellNeutralBuyStrong buy
Neutral
SellBuy
Strong sellStrong buy
Strong sellSellNeutralBuyStrong buy
Neutral
SellBuy
Strong sellStrong buy
Strong sellSellNeutralBuyStrong buy
Displays a symbol's price movements over previous years to identify recurring trends.
Frequently Asked Questions
The current price of SYM is 50.85 USD — it has decreased by −5.75% in the past 24 hours. Watch Symbotic Inc. stock price performance more closely on the chart.
Depending on the exchange, the stock ticker may vary. For instance, on NASDAQ exchange Symbotic Inc. stocks are traded under the ticker SYM.
SYM stock has fallen by −2.51% compared to the previous week, the month change is a 28.21% rise, over the last year Symbotic Inc. has showed a 89.74% increase.
We've gathered analysts' opinions on Symbotic Inc. future price: according to them, SYM price has a max estimate of 60.00 USD and a min estimate of 10.00 USD. Watch SYM chart and read a more detailed Symbotic Inc. stock forecast: see what analysts think of Symbotic Inc. and suggest that you do with its stocks.
SYM stock is 9.88% volatile and has beta coefficient of 2.69. Track Symbotic Inc. stock price on the chart and check out the list of the most volatile stocks — is Symbotic Inc. there?
Today Symbotic Inc. has the market capitalization of 5.55 B, it has increased by 10.35% over the last week.
Yes, you can track Symbotic Inc. financials in yearly and quarterly reports right on TradingView.
Symbotic Inc. is going to release the next earnings report on Aug 6, 2025. Keep track of upcoming events with our Earnings Calendar.
SYM earnings for the last quarter are 0.06 USD per share, whereas the estimation was 0.04 USD resulting in a 42.54% surprise. The estimated earnings for the next quarter are 0.05 USD per share. See more details about Symbotic Inc. earnings.
Symbotic Inc. revenue for the last quarter amounts to 549.65 M USD, despite the estimated figure of 522.41 M USD. In the next quarter, revenue is expected to reach 533.25 M USD.
SYM net income for the last quarter is −3.92 M USD, while the quarter before that showed −3.48 M USD of net income which accounts for −12.92% change. Track more Symbotic Inc. financial stats to get the full picture.
No, SYM doesn't pay any dividends to its shareholders. But don't worry, we've prepared a list of high-dividend stocks for you.
As of Aug 2, 2025, the company has 1.65 K employees. See our rating of the largest employees — is Symbotic Inc. on this list?
EBITDA measures a company's operating performance, its growth signifies an improvement in the efficiency of a company. Symbotic Inc. EBITDA is −25.35 M USD, and current EBITDA margin is −3.33%. See more stats in Symbotic Inc. financial statements.
Like other stocks, SYM shares are traded on stock exchanges, e.g. Nasdaq, Nyse, Euronext, and the easiest way to buy them is through an online stock broker. To do this, you need to open an account and follow a broker's procedures, then start trading. You can trade Symbotic Inc. stock right from TradingView charts — choose your broker and connect to your account.
Investing in stocks requires a comprehensive research: you should carefully study all the available data, e.g. company's financials, related news, and its technical analysis. So Symbotic Inc. technincal analysis shows the buy rating today, and its 1 week rating is buy. Since market conditions are prone to changes, it's worth looking a bit further into the future — according to the 1 month rating Symbotic Inc. stock shows the buy signal. See more of Symbotic Inc. technicals for a more comprehensive analysis.
If you're still not sure, try looking for inspiration in our curated watchlists.
If you're still not sure, try looking for inspiration in our curated watchlists.