$AGLE Next Target PTs 1-1.50 and higherAeglea BioTherapeutics, Inc., a clinical-stage biotechnology company, designs and develops human enzyme therapeutics for the treatment of patients and families with rare metabolic diseases. The company's lead product candidate is pegzilarginase, a recombinant human Arginase 1 that is in Phase III PE
Next report date
—
Report period
—
EPS estimate
—
Revenue estimate
—
−3.03 USD
−149.56 M USD
0.00 USD
51.56 M
About Spyre Therapeutics, Inc.
Sector
Industry
CEO
Cameron Turtle
Website
Headquarters
Waltham
Founded
2013
FIGI
BBG0067L94B2
Spyre Therapeutics, Inc. is a clinical-stage biotechnology company, which engages in the development of next-generation human enzyme therapeutics as disruptive solutions for rare and other high-burden diseases. Its product, Pegzilarginase, is in a Phase 3 pivotal trial for the treatment of Arginase 1 Deficiency. The company was founded by George Georgiou and David G. Lowe on December 16, 2013 and is headquartered in Waltham, MA.

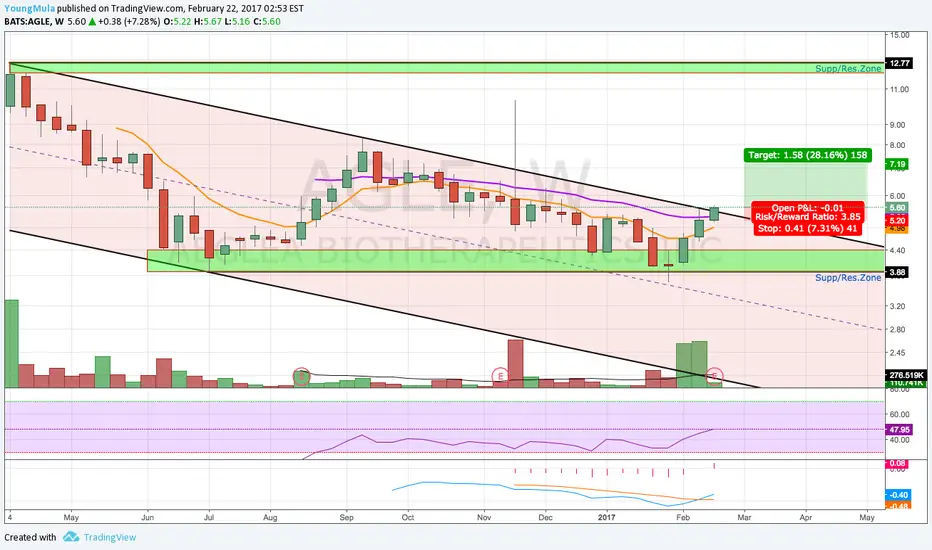
Aeglea BioTherapeutics due for a fat recovery. AGLEIn percentage terms anyway.
We are not in the business of getting every prediction right, no one ever does and that is not the aim of the game. The Fibonacci targets are highlighted in green with invalidation in red. Fibonacci goals, it is prudent to suggest, are nothing more than mere fractally e

Market Alpha Stock WatchlistNASDAQ:AGLE
Symbol came up on our watchlist scanner. If anyone is watching this one here are some levels.

$AGLE - AEGLEA BIOTHERAPEUTICS INC // LONG$AGLE is in an uptrend and bounced nicely around .618. Going Forward, this should act as key support.
Stop-loss and targets are given in the chart.


Relatively good time to buy because of supportAfter the stock dips to around $6.6, it will bounce up.

KALV - Fallen angel breakout long from $9.57 to $14.33KALV seems breaking out after a long sidewise movement. Recently it had a good breakout & now seems getter ready for a break again.
It also has some insider buying. We think it will continue upward from its current label.
* Trade Criteria *
Date First Found- December 26, 2017
Pattern/Why- Buying

AGLE - Bump & Run formation Long from $5.32/$5.71 to $7.27AGLE seems breaking out of an upward channel formation like the Pharmaceutical sector itself. It has good insider buying.
We think it has very good upward potential.
* Trade Criteria *
Date First Found- December 26, 2017
Pattern/Why- Downward channel breakout, Bump & Run formation
Entry Target

Idea for AGLEOn va essayer de chercher la résistance + étoile doji haussière après micro tendance baissière, retournement ? Je le pense !

See all ideas
Summarizing what the indicators are suggesting.
Neutral
SellBuy
Strong sellStrong buy
Strong sellSellNeutralBuyStrong buy
Neutral
SellBuy
Strong sellStrong buy
Strong sellSellNeutralBuyStrong buy
Neutral
SellBuy
Strong sellStrong buy
Strong sellSellNeutralBuyStrong buy
An aggregate view of professional's ratings.
Neutral
SellBuy
Strong sellStrong buy
Strong sellSellNeutralBuyStrong buy
Neutral
SellBuy
Strong sellStrong buy
Strong sellSellNeutralBuyStrong buy
Neutral
SellBuy
Strong sellStrong buy
Strong sellSellNeutralBuyStrong buy
Displays a symbol's price movements over previous years to identify recurring trends.
Related stocks
Frequently Asked Questions
The current price of SYRE is 17.17 USD — it has increased by 0.61% in the past 24 hours. Watch Spyre Therapeutics, Inc. stock price performance more closely on the chart.
Depending on the exchange, the stock ticker may vary. For instance, on NASDAQ exchange Spyre Therapeutics, Inc. stocks are traded under the ticker SYRE.
SYRE stock has risen by 8.63% compared to the previous week, the month change is a 20.09% rise, over the last year Spyre Therapeutics, Inc. has showed a −51.54% decrease.
We've gathered analysts' opinions on Spyre Therapeutics, Inc. future price: according to them, SYRE price has a max estimate of 71.00 USD and a min estimate of 21.00 USD. Watch SYRE chart and read a more detailed Spyre Therapeutics, Inc. stock forecast: see what analysts think of Spyre Therapeutics, Inc. and suggest that you do with its stocks.
SYRE reached its all-time high on Apr 8, 2016 with the price of 318.75 USD, and its all-time low was 2.66 USD and was reached on Jun 21, 2023. View more price dynamics on SYRE chart.
See other stocks reaching their highest and lowest prices.
See other stocks reaching their highest and lowest prices.
SYRE stock is 5.63% volatile and has beta coefficient of 1.87. Track Spyre Therapeutics, Inc. stock price on the chart and check out the list of the most volatile stocks — is Spyre Therapeutics, Inc. there?
Today Spyre Therapeutics, Inc. has the market capitalization of 1.00 B, it has increased by 3.60% over the last week.
Yes, you can track Spyre Therapeutics, Inc. financials in yearly and quarterly reports right on TradingView.
Spyre Therapeutics, Inc. is going to release the next earnings report on Jul 31, 2025. Keep track of upcoming events with our Earnings Calendar.
SYRE earnings for the last quarter are −0.60 USD per share, whereas the estimation was −0.84 USD resulting in a 28.66% surprise. The estimated earnings for the next quarter are −0.75 USD per share. See more details about Spyre Therapeutics, Inc. earnings.
Spyre Therapeutics, Inc. revenue for the last quarter amounts to 0.00 USD, matching the estimated figure, and no changes in revenue are expected for the next quarter.
SYRE net income for the last quarter is −36.09 M USD, while the quarter before that showed −43.67 M USD of net income which accounts for 17.37% change. Track more Spyre Therapeutics, Inc. financial stats to get the full picture.
No, SYRE doesn't pay any dividends to its shareholders. But don't worry, we've prepared a list of high-dividend stocks for you.
As of Jun 6, 2025, the company has 65 employees. See our rating of the largest employees — is Spyre Therapeutics, Inc. on this list?
Like other stocks, SYRE shares are traded on stock exchanges, e.g. Nasdaq, Nyse, Euronext, and the easiest way to buy them is through an online stock broker. To do this, you need to open an account and follow a broker's procedures, then start trading. You can trade Spyre Therapeutics, Inc. stock right from TradingView charts — choose your broker and connect to your account.
Investing in stocks requires a comprehensive research: you should carefully study all the available data, e.g. company's financials, related news, and its technical analysis. So Spyre Therapeutics, Inc. technincal analysis shows the buy rating today, and its 1 week rating is sell. Since market conditions are prone to changes, it's worth looking a bit further into the future — according to the 1 month rating Spyre Therapeutics, Inc. stock shows the sell signal. See more of Spyre Therapeutics, Inc. technicals for a more comprehensive analysis.
If you're still not sure, try looking for inspiration in our curated watchlists.
If you're still not sure, try looking for inspiration in our curated watchlists.