TQQQ WEEKLY TRADE IDEA (07/28/2025)
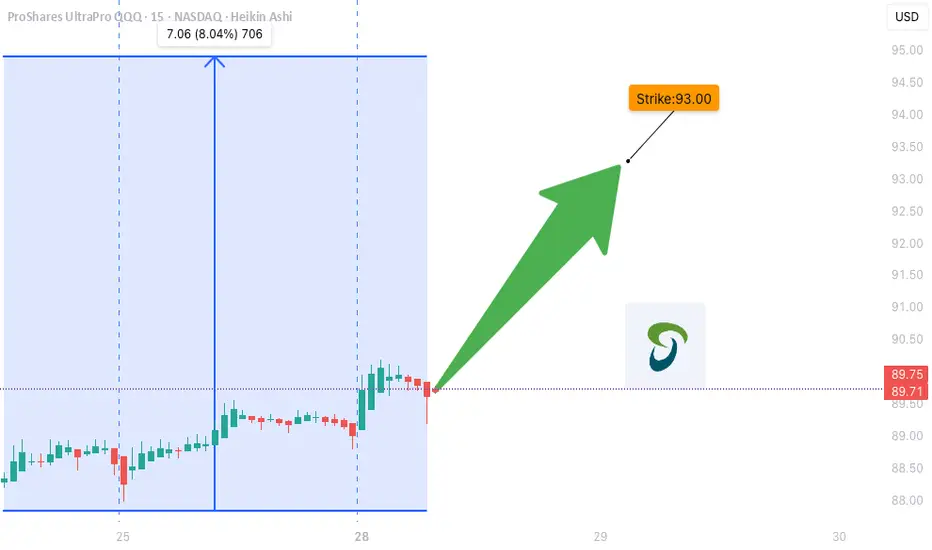
**🚀 TQQQ WEEKLY TRADE IDEA (07/28/2025) 🚀**
**Triple-Leveraged Momentum Play — But Watch the Volume Trap!**
---
📈 **Momentum Snapshot:**
* **Daily RSI:** 75.0 ⬆️
* **Weekly RSI:** 70.1 ⬆️
🔥 Bullish across **all timeframes** = strong trend confirmation
📊 **Options Flow:**
* **Call Volume:** 2
Key stats
About ProShares UltraPro QQQ
Home page
Inception date
Feb 9, 2010
Structure
Open-Ended Fund
Replication method
Synthetic
Dividend treatment
Distributes
Distribution tax treatment
Ordinary income
Income tax type
Capital Gains
Max ST capital gains rate
39.60%
Max LT capital gains rate
20.00%
Primary advisor
ProShare Advisors LLC
Distributor
SEI Investments Distribution Co.
TQQQ is a levered fund that delivers 3x exposure only over a one-day holding period of NASDAQ-100 stocks. The underlying index includes 100 of the largest non-financial companies listed on NASDAQ based on market capitalization. Historically, technology companies have dominated TQQQs underlying index, so, its future performance might be closely tied to the performance of the tech industry. The fund uses a mathematical approach to determine the type, quantity and mix of investment positions that it believes will produce daily returns consistent with its investment objective. Like many levered products, the fund is not a buy-and-hold ETF as it's a very short-term tactical instrument.
Related funds
Classification
What's in the fund
Exposure type
Technology Services
Electronic Technology
Cash
Government
Stock breakdown by region
Top 10 holdings
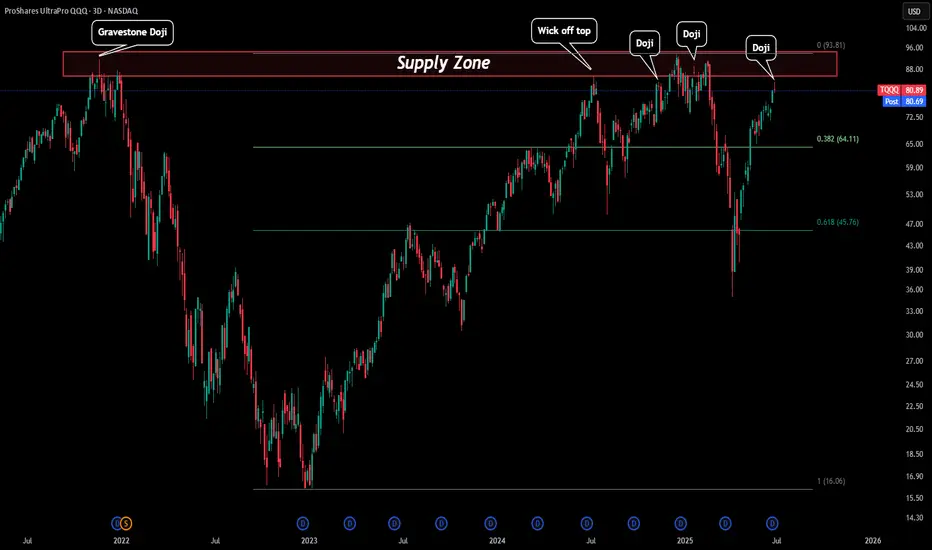
TQQQ - Red Days Ahead?TQQQ just created a 3D doji. The reason this is important is everytime we have seen reversal candles close to or in our red box (Supply zone) usually we see selloffs follow.
Price came very close to the red box and created a 3D reversal doji that could signal some downside price action. If this is
$TQQQ - $78 ishHey guys, the AI helped me ride the wayve from 68 all the way to 76. With a small pullback the AI says we'll see something around the range of 77.5 ish, closer to 78 quite soon.
Would buy all opporutnites below the 75 range. Anything below 72.5 is a crazy buy and anything below $70 for the moment m

$TQQQ Weirdly mildly bullishDon't understand why, don't care. My AI gave of a partial bullishness signal for tomorrow onwards for TQQQ. It believes this a buy the dip moment (Unless it changes it's mind for whatever reason).
This is a signal on 3 out of 16 of my 3.6 sharpe models which is fairly bullish. I also had a UVXY cal

$TQQQ - Small moonThe AI has been triggered on TQQQ and UVXY. Calls on TQQQ and puts on UVXY.
The models i have on these have a sharpe of around 3.4-3.6 which means these are almost guaranteed money making trades as long as your entry point is good.
I'm waiting for confirmation before i go in but i'm likely to enter

TQQQ Day Trade Plan for 04/29/2025TQQQ Day Trade Plan for 04/29/2025
📈 55.10 55.60
📉 52.10 51.60
Thanks to all my followers! Truly appreciate the support!
Please like and share for more ES/NQ levels Tues & Thurs 🤓📈📉🎯💰
*These levels are derived from comprehensive backtesting and research and a quantitative system demonstrating hi

NASDAQ Long Term: Deep in Bear MarketAn indicator works until it does not.
The SMA256 on the DAY chart of NASDAQ (QQQ/TQQQ) )has been respected multiple times as both supports and resistances since the end of COVID bullish run starting 2022.
For long-term trend-following traders, this chart shows we are now deep in the bear market

Opening (IRA): TQQQ April 4th 70 Covered Call... for a 68.05 debit.
Comments: Starter position in the first weekly in April ... .
Metrics:
Buying Power Effect/Break Even: 68.05
Max Profit: 1.95
ROC at Max: 2.87%
50% Max: .98
ROC at 50% Max: 1.44%
Will generally look to take profit at 50% max, add at intervals assuming I can get in at stri

Opening (IRA): TQQQ April 17th 60 Covered Call... for a 57.91 debit.
Comments: Adding at strikes better than what I currently have on ... . Here, going lower net delta by selling the -84 call against shares to emulate the delta metrics of a 2 x expected move 16 delta short put, but with the built-in defense of the short call.
Metrics:
Buyi

Buy and Sell zones for TQQQ Showing Same Sell Signals as SP500
TQQQ buy and sell zones showing in green and red. Yellow is where there is likely to be chop. The monthly starts to give clarity and confirmation of the key tend breaks and the appropriate response from the market this week.
These sell zones correlate nicely with the SP500. I would add to my s

See all ideas
Summarizing what the indicators are suggesting.
Oscillators
Neutral
SellBuy
Strong sellStrong buy
Strong sellSellNeutralBuyStrong buy
Oscillators
Neutral
SellBuy
Strong sellStrong buy
Strong sellSellNeutralBuyStrong buy
Summary
Neutral
SellBuy
Strong sellStrong buy
Strong sellSellNeutralBuyStrong buy
Summary
Neutral
SellBuy
Strong sellStrong buy
Strong sellSellNeutralBuyStrong buy
Summary
Neutral
SellBuy
Strong sellStrong buy
Strong sellSellNeutralBuyStrong buy
Moving Averages
Neutral
SellBuy
Strong sellStrong buy
Strong sellSellNeutralBuyStrong buy
Moving Averages
Neutral
SellBuy
Strong sellStrong buy
Strong sellSellNeutralBuyStrong buy
Displays a symbol's price movements over previous years to identify recurring trends.
Frequently Asked Questions
An exchange-traded fund (ETF) is a collection of assets (stocks, bonds, commodities, etc.) that track an underlying index and can be bought on an exchange like individual stocks.
TQQQ trades at 83.13 USD today, its price has fallen −4.10% in the past 24 hours. Track more dynamics on TQQQ price chart.
TQQQ net asset value is 88.20 today — it's risen 6.20% over the past month. NAV represents the total value of the fund's assets less liabilities and serves as a gauge of the fund's performance.
TQQQ assets under management is 27.39 B USD. AUM is an important metric as it reflects the fund's size and can serve as a gauge of how successful the fund is in attracting investors, which, in its turn, can influence decision-making.
TQQQ price has risen by 5.13% over the last month, and its yearly performance shows a 21.22% increase. See more dynamics on TQQQ price chart.
NAV returns, another gauge of an ETF dynamics, have risen by 6.20% over the last month, showed a 55.53% increase in three-month performance and has increased by 42.39% in a year.
NAV returns, another gauge of an ETF dynamics, have risen by 6.20% over the last month, showed a 55.53% increase in three-month performance and has increased by 42.39% in a year.
TQQQ fund flows account for −3.89 B USD (1 year). Many traders use this metric to get insight into investors' sentiment and evaluate whether it's time to buy or sell the fund.
Since ETFs work like an individual stock, they can be bought and sold on exchanges (e.g. NASDAQ, NYSE, EURONEXT). As it happens with stocks, you need to select a brokerage to access trading. Explore our list of available brokers to find the one to help execute your strategies. Don't forget to do your research before getting to trading. Explore ETFs metrics in our ETF screener to find a reliable opportunity.
TQQQ invests in stocks. See more details in our Analysis section.
TQQQ expense ratio is 0.84%. It's an important metric for helping traders understand the fund's operating costs relative to assets and how expensive it would be to hold the fund.
Yes, TQQQ is a leveraged ETF, meaning it uses borrowings or financial derivatives to magnify the performance of the underlying assets or index it follows.
In some ways, ETFs are safe investments, but in a broader sense, they're not safer than any other asset, so it's crucial to analyze a fund before investing. But if your research gives a vague answer, you can always refer to technical analysis.
Today, TQQQ technical analysis shows the sell rating and its 1-week rating is buy. Since market conditions are prone to changes, it's worth looking a bit further into the future — according to the 1-month rating TQQQ shows the buy signal. See more of TQQQ technicals for a more comprehensive analysis.
Today, TQQQ technical analysis shows the sell rating and its 1-week rating is buy. Since market conditions are prone to changes, it's worth looking a bit further into the future — according to the 1-month rating TQQQ shows the buy signal. See more of TQQQ technicals for a more comprehensive analysis.
Yes, TQQQ pays dividends to its holders with the dividend yield of 1.05%.
TQQQ trades at a premium (0.01%).
Premium/discount to NAV expresses the difference between the ETF’s price and its NAV value. A positive percentage indicates a premium, meaning the ETF trades at a higher price than the calculated NAV. Conversely, a negative percentage indicates a discount, suggesting the ETF trades at a lower price than NAV.
Premium/discount to NAV expresses the difference between the ETF’s price and its NAV value. A positive percentage indicates a premium, meaning the ETF trades at a higher price than the calculated NAV. Conversely, a negative percentage indicates a discount, suggesting the ETF trades at a lower price than NAV.
TQQQ shares are issued by ProShare Advisors LLC
TQQQ follows the NASDAQ 100 Index. ETFs usually track some benchmark seeking to replicate its performance and guide asset selection and objectives.
The fund started trading on Feb 9, 2010.
The fund's management style is passive, meaning it's aiming to replicate the performance of the underlying index by holding assets in the same proportions as the index. The goal is to match the index's returns.