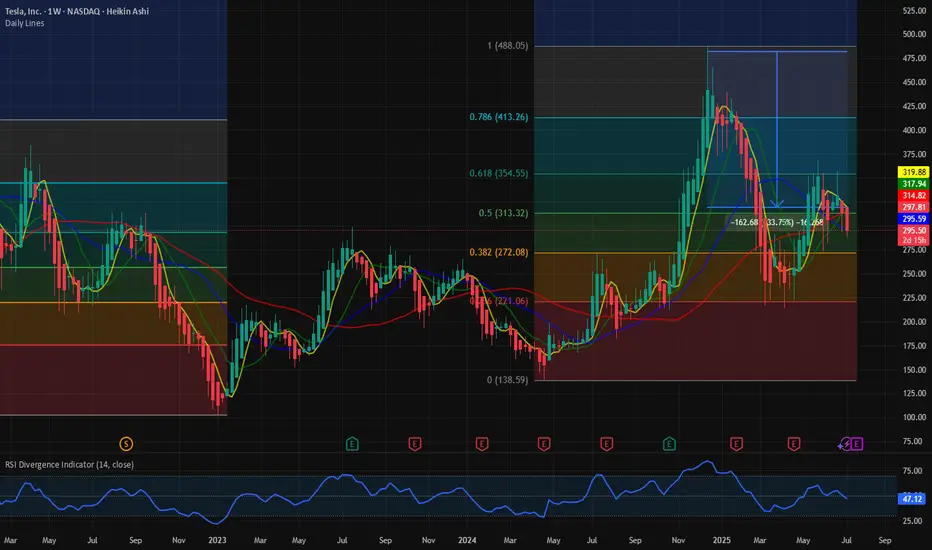
$TSLA: Battleground stock. There’re better way to make money. In this bull market where almost all the stocks are working, NASDAQ:TSLA seems to be still in the penalty box. When NASDAQ:NVDA , NASDAQ:MSFT are at ATH and most of the Mag7 are near to the ATH. NASDAQ:TSLA is still 33% below its ATH of 484 $. And the price action is not particularly bullish. This week NASDAQ:AVGO crossed NASDAQ:TSLA with a larger Market Cap cos. May be NASDAQ:AVGO should replace NASDAQ:TSLA in MAG7. A food for thought.
With such poor price action and the price stuck within the 0.618 and 0.382 Fib retracement levels the stock has not looked bullish recently. IN this recent market reversal all the speculative sectors like Quantum, Space stocks and Drone stocks are working, NASDAQ:TSLA is still searching for direction. In my opinion NASDAQ:TSLA has a great future with a visionary leader, but it might end up being a good company but not a good stock. With controversy surrounding the leadership it has become a battle ground stock. There are many large cap liquid stocks where the positive momentum is working. Until the stock breaks out of this consolidating pattern it’s better to make money somewhere else.
Verdict: Stay on sidelines for NASDAQ:TSLA stock. Accumulate if you need to. Buy it above 400 $ once momentum is back.
TSLA trade ideas
Stocks SPOT ACCOUNT: TESLA stocks buy trade with take profitStocks SPOT ACCOUNT: MARKETSCOM:TESLA stocks my buy trade with take profit.
Buy Stocks at 297 and Take Profit at 319.
This is my SPOT Accounts for Stocks Portfolio.
Trade shows my Buying and Take Profit Level.
Spot account doesn't need SL because its stocks buying account.

Tesla's Self-Inflicted Crisis of ConfidenceInvestors wanted Elon Musk to double down on EVs. Instead, they got a new political party and another reason to sell the stock.
Musk vs Trump: A Fight Investors Didn’t Ask For
Tesla’s latest sell-off has little to do with earnings or electric vehicles. Shares dropped 6.8% on Monday after Elon Musk announced plans to launch a new US political party, escalating his feud with Donald Trump and reigniting investor concerns about distraction at the top.
The fallout from Musk’s political re-entry has been swift. Tesla’s valuation has lost over $200 billion since late May, when Musk’s role in Trump’s short-lived government efficiency task force came to an end. His renewed focus on political activism contradicts April’s pledge to spend “far more” time on Tesla, and comes at a moment when the business is already under pressure from slowing EV sales and collapsing regulatory tailwinds.
Politics, Profits and a Shrinking Mandate
Trump’s so-called “big, beautiful bill” is slashing support for electric vehicles across the board. Gone is the $7,500 federal tax credit, set to expire in September. Gone too are the emissions penalties that allowed Tesla to bank billions in regulatory credits from legacy automakers. William Blair analysts estimate that over $2 billion in high-margin profit is now at risk.
The political clash is getting personal. Trump has mocked Musk’s behaviour as a “train wreck”, suggested deportation, and floated nationalising SpaceX. Investors, meanwhile, are left questioning whether Musk’s growing list of battles is starting to erode Tesla’s long-term advantage. The distraction risk is real, and the market is responding.
Technical Breakdown: Key Levels in Play
Tesla’s share price has woefully underperformed this year. The stock is down 22% year-to-date, while the S&P 500 is up 6%. Recent price action highlights just how vulnerable Tesla has become to the political whims of its CEO. The public fallout with Trump helped define a new swing high in May, which now acts as clear resistance. A new swing low was formed in early June, and that is now the short-term level bulls need to defend.
Adding Keltner Channels to the chart puts the recent volatility into perspective. The sideways bands and price bouncing between them show a market stuck in broad equilibrium. There’s little directional conviction, but that may be changing. Monday’s sell-off pushed Tesla below the volume-weighted average price anchored to the April lows. If the shares remain below this VWAP and break under the June swing lows, it would confirm the attempted recovery has failed and signal that the bears are back in control.
For now, Tesla isn’t trading like a high-growth innovator. It’s trading like a politically charged meme stock with no clear trend and no adult supervision.
Tesla (TSLA) Daily Candle Chart
Past performance is not a reliable indicator of future results
Disclaimer: This is for information and learning purposes only. The information provided does not constitute investment advice nor take into account the individual financial circumstances or objectives of any investor. Any information that may be provided relating to past performance is not a reliable indicator of future results or performance. Social media channels are not relevant for UK residents.
Spread bets and CFDs are complex instruments and come with a high risk of losing money rapidly due to leverage. 85.24% of retail investor accounts lose money when trading spread bets and CFDs with this provider. You should consider whether you understand how spread bets and CFDs work and whether you can afford to take the high risk of losing your money.

$TSLA hanging by a threadNASDAQ:TSLA getting rocked again today. Gapped down over 7% at open. Literally hanging by a thread on the bottom of the daily cloud. It's also OUTSIDE of the bottom Bollinger band...
Also otm call flow just came in $1.8 million 325c 7/25 @ 6.40

Better MACDWhat is the MACD?
The MACD (Moving Average Convergence Divergence) is a momentum and trend-following indicator. It’s based on the difference between two EMAs (Exponential Moving Averages) and helps spot:
Trend direction
Momentum shifts
Reversals
Entry/exit points
✅ Basic MACD Techniques
1. Signal Line Crossovers
Bullish Crossover: MACD line crosses above Signal → buy signal
Bearish Crossover: MACD line crosses below Signal → sell signal
🔸 Works best in trending environments, 200 SMA as a filter.
🔸 Combine with volume or trend filters for best results
2. Zero Line Crossovers
When MACD crosses above 0, the shorter EMA is above the longer EMA → bullish. This is typically the sign of a larger trend than crossovers.
When MACD crosses below 0, shorter EMA is below → bearish
🔸 Zero line = baseline momentum direction
🔸 Cross above = bullish trend confirmation
🔸 Cross below = bearish confirmation
3. Histogram Momentum
The histogram is often the first sign of a shift before a crossover happens.
Read it like this:
Histogram growing: Increasing momentum in that direction
Histogram shrinking: Momentum is fading
Histogram changing color (in many indicators): Potential reversal
🔸 Use histograms to get early signals, even before crossovers. Confirmed with volume surge and Price Action.
🔍 Advanced MACD Tricks
📉 4. Divergence Detection
Divergence occurs when price and MACD move in opposite directions.
🔸 Bullish Divergence:
Price makes lower lows
MACD makes higher lows
→ Hidden buying pressure, trend reversal likely
🔸 Bearish Divergence:
Price makes higher highs
MACD makes lower highs
→ Trend weakening, reversal likely
🔹 Confirm with:
RSI, when the lower timeframe RSI is oversold and the higher timeframe MACD is rising, then it's a good sign, and the opposite is true for bears.
Support/resistance zone: draw trendlines either on the volume or price and watch out for retests on the breakout.
Candlestick reversal patterns: some bearish patterns are bullish on indexes because of dollar cost averaging.

Long-Term Growth Potential in the Face of Short-Term ChallengesCurrent Price: $323.63
Direction: LONG
Targets:
- T1 = $331.50
- T2 = $345.00
Stop Levels:
- S1 = $319.50
- S2 = $310.00
**Wisdom of Professional Traders:**
This analysis synthesizes insights from thousands of professional traders and market experts, leveraging collective intelligence to pinpoint high-probability trade setups. The wisdom of crowds principle suggests that aggregated perspectives from experienced professionals build a more balanced outlook on Tesla, reducing emotional biases and highlighting consensus opportunities in the market.
**Key Insights:**
Tesla is currently navigating through a challenging phase characterized by competitive pressures in both China and Europe. Recent macroeconomic headwinds, including rising interest rates and shrinking global spending on electric vehicles, have fueled concerns about short-term sales performance. However, analysts remain optimistic about Tesla's innovation leadership, particularly in AI-driven robotics, battery technology, and autonomous mobility development. The recent technical charts reflect a narrowing wedge formation, and a breakout above $354.78 could confirm renewed bullish momentum, offering significant upside potential.
**Recent Performance:**
Over the past few weeks, Tesla has experienced tight price consolidation, underlying near-term indecision among market participants. While its stock price remains below short-term moving averages, signaling bearish pressure, longer-term sentiment is bolstered by overall optimism in the technology sector. Additionally, fluctuations in deliveries and revenue from various regions continue to impact day-to-day trading sentiment, with the stock showcasing higher volatility during earnings updates.
**Expert Analysis:**
Market analysts exhibit cautious optimism surrounding Tesla. Short-term concerns linger about declining sales growth in legacy markets such as Europe and the loss of its dominant position in China due to rising competition from local manufacturers like BYD. However, whether Tesla can monetize its cutting-edge developments in AI, robotics, and autonomous driving remains a focal point of its long-term strategy. Analysts agree that while these initiatives may redefine the EV market over the next 5-10 years, revenue realization is expected to be slow and could dampen speculative enthusiasm in the immediate term.
**News Impact:**
Tesla recently announced the launch of its robo-taxi initiative, beginning trials in Austin, Texas, a move that challenges traditional mobility norms. While this innovation enhances Tesla's narrative as a disruptor in the industry, regulatory obstacles and scalability issues pose immediate hurdles that could delay market adoption. On the downside, Tesla saw declining deliveries in Europe and China, casting shadows over its near-term growth prospects in these critical regions. Investors should keep a close eye on upcoming earnings reports for clearer guidance on production schedules and delivery forecasts.
**Trading Recommendation:**
Based on recent technical consolidation and consensus expert views, traders are recommended to take a long position on Tesla with price targets of $331.50 and $345.00. The stock exhibits signs of medium-term upside potential if momentum aligns with broader bullish trends in the S&P 500 and technology sectors. Implement disciplined risk management with stop levels set at $319.50 and $310.00 to protect against unfavorable moves. Investing in Tesla provides exposure to a high-risk innovation-driven narrative; traders should evaluate their appetite for risk carefully before entering this position.

TSLA: GEX Points to Bounce Setup. Is This the Dip to Load Calls?📊 GEX-Based Options Suggestion
Gamma Exposure (GEX) data paints a bullish opportunity if TSLA holds the critical support zones:
* ✅ Key GEX Levels:
* $338: Near current price, minor GEX flip zone.
* $345–$350: Strong upward magnets (3rd Call Wall + GEX build-up).
* $359: Gamma Wall + Highest Net Positive GEX — market makers may pin price near this into end of week if bulls hold.
* 🛡️ Below Support:
* $330: Light PUT defense.
* $320: Major Put Support (-67.5%) — strong bounce zone if downside accelerates.
🔔 Option Trade Idea Based on GEX:
With TSLA near the $338 zone and GEX showing stacked resistance above + positive net exposure, a high-risk/reward call entry is forming.
* Play: Buy 345C or 350C expiring 06/28 or 07/05
* Trigger: Only if price holds $335+ and shows strength with volume bounce
* Target: $345 → $350 → potential pin near $359 (Gamma Wall)
* Stop: Close under $332 invalidates the bounce setup
🧠 Trading Setup – 1H Chart (Second Image)
From the second image, we analyze price action and structure to validate the GEX idea:
📉 Market Structure:
* Price is pulling back into a prior demand zone from $335–$338.
* Trendline support + Fair Value Gap zone + SMC CHoCH aligning at this base.
* Multiple bullish CHoCHs suggest potential reaccumulation if support holds.
🎯 Trading Plan Based on Price Action:
Bullish Case (Base Holds):
* Entry: $335–$338 zone (bounce off trendline and demand zone)
* Target: $345 (GEX level) → $348 → $350
* Stop-Loss: $331
High confluence with GEX option play. Use volume spike for confirmation.
Bearish Breakdown Scenario:
* Trigger: Loss of $331 + trendline break
* Target: $325 → $320 (strong PUT wall support)
* Put Options: 325P or 320P if breakdown triggers with momentum
⚠️ Summary:
TSLA is entering a decision zone — GEX shows bullish opportunity if $335 support holds, with upside targets toward $350–$359. But if price breaks under $330, expect a flush toward PUT support.
Patience is key — let price confirm the bounce or the break.
This setup is for educational purposes only. Trade with discipline and use stops. Always do your own research.

Technical Analysis – TSLAChart Summary:
Current Price: ~$349.21
Local Top: ~$357.53 (100% Fib extension)
Bearish Rejection: Notable wick + retrace from 0.886–1.0 zone
Probable Pullback Zone: 343.00–338.50 (Fibonacci 0.618–0.5 retracement)
Major Support Levels:
$334.50 – Prior key horizontal + Fib confluence
$311.62 – Historical demand zone
Projection:
Intraday double-leg correction toward $338–$343
Possible bounce and continuation toward the golden target zone:
$366.47 (1.236 Fib)
$374.16–$380.95 (1.618 zone)
🌍 Macro Alignment
Bullish backdrop:
Tech sector leading broader rally
Tesla’s robotaxi and AI narrative lifting sentiment
Oil down → margin relief for EV production
Catalysts this week: Powell testimony, PCE inflation
📈 Trading Plan
Type Direction Entry Target(s) Stop Loss Confidence
Intraday Bearish $352–$353 rejection zone $343 → $338.5 Above $357.5 🔶 Medium
Swing (Buy the dip) Bullish $338–$334 zone $366.47 → $374.16 Below $330 🟢 Strong
📌 Suggested Strategy
Scalp short if rejection at $353.2–$357.5 confirms with bearish candle on volume.
Add long exposure if price consolidates or reverses from the $338–$334.5 support area.
Monitor Powell’s remarks – Any dovish tilt could accelerate tech upside.
TSLA sentiment remains strong, but intraday shakeouts are expected.
✍️ Summary Signal
“TSLA remains bullish on a swing basis, but intraday looks set for a Fibonacci pullback to $338–$334. Buy dips if structure holds. Macro backdrop (robotaxi + Fed pause) supports continuation to $366–$374.”

Tesla, Inc. (TSLA) Boosted by Energy StorageTesla, Inc. (TSLA) is a global leader in electric vehicles, clean energy solutions, and battery technology. The company designs and manufactures EVs, solar products, and energy storage systems that help drive the transition to sustainable energy. Tesla’s growth is fueled by rising EV adoption, battery innovations, and expansion into new markets with its cutting-edge technologies.
On the chart, a confirmation bar with increasing volume signals strong buying interest. The price has moved into the momentum zone by breaking above the .236 Fibonacci level. A trailing stop can be set just below this level using the Fibonacci snap tool to protect gains as momentum continues.

Launch of Robotaxi Service Boosts Tesla Share Price by Over 8%Launch of Robotaxi Service Boosts Tesla (TSLA) Share Price by Over 8%
As previously announced by Elon Musk, Tesla has launched its robotaxi service in Austin, Texas. The cost of a ride is $4.20.
The service is not yet fully operational. It is more of an extended testing phase, as access is currently by invitation only, and a Tesla employee may be present in the back seat.
Nevertheless, the market responded positively — Tesla (TSLA) shares rose by more than 8% (comparing the closing prices of daily candlesticks).
Technical Analysis of TSLA Share Price Chart
In our 11 June publication, we:
→ identified an ascending channel;
→ highlighted the May support level (marked with an arrow), suggesting it could act as resistance following a bearish breakout.
Since then:
→ the channel has remained relevant;
→ the aforementioned level acted as resistance but was broken by the bulls yesterday.
As a result, the TSLA share price has reached the median of the current ascending channel, where it may find equilibrium and form a consolidation zone once the initial positive reaction to the robotaxi launch subsides.
It is also worth noting the stock’s resilience following Elon Musk’s controversy with President Trump — the price has already risen more than 28% from the June low, indicating the potential for a scenario in which resistance at $365 is tested.
This article represents the opinion of the Companies operating under the FXOpen brand only. It is not to be construed as an offer, solicitation, or recommendation with respect to products and services provided by the Companies operating under the FXOpen brand, nor is it to be considered financial advice.

TSLA long scenario
TSLA long scenario
1.. important Registance ( $370 )
if break midpoint ( $370 ) next TP $457
2. i expect some correction near $ 330
it will be one more buy chance
-----------------------------------------
based on price action
harmonic theory

Bearish Elliot Triangle Wave $250 targetObserving Tesla Chart, I noticed a bearish 4hr Elliot Wave A-E. The flow is also bearish and lines up with the bear sentiment. Looking for a bearish Apex Breakout..

TSLA Breaking Out! Is This Just the Beginning or a Trap? Jun 24 🔥Price Action Overview:
TSLA had a powerful move, jumping +8.23% to $348.68. It cleared key resistance and now consolidates near $349–350. Volume surged, but we’re seeing a bull flag structure with some internal weakness forming.
🧠 Smart Money Market Structure (15-min Chart)
* CHoCH occurred before the breakout, showing smart money accumulation.
* Break of Structure (BOS) confirms bullish intent.
* Price is now ranging in a supply zone, rejecting upper levels with signs of compression.
* Consolidation wedge suggests a possible breakout or fakeout setup.
🔮 Gamma Exposure (GEX) Breakdown (1h Chart)
* Current Price: $348.68
* Gamma Resistance (Call Wall):
* $357.53 → 1st resistance
* $365.00 → heavy resistance
* $367.5 → Extreme Call Wall / GEXY8
* Gamma Support:
* $340 → strong support
* $320 → HVL (High Volume Level) and PUT defense
* $315 / 312.5 → 2nd PUT Wall (if breakdown)
Interpretation:
Price is trapped between GEX compression levels. A breakout above $350 could trigger a gamma squeeze toward $357–360+. A breakdown below $340 targets $320 fast.
📈 Indicators Snapshot
* Volume: High on the breakout, but tapering off during consolidation.
* RSI/MACD (not shown): Likely cooling off — favoring a pullback or re-accumulation.
* CHoCH & OB Zones: Indicate smart money watching $340-$345 for support retest.
⚖️ Scalping vs Swing Outlook
✅ Bullish Case
* Break above $350 → Watch $357.50 and $365 targets.
* Above $367 = gamma squeeze zone unlocked.
Entry: Break and hold $350
Target: $357.50, then $365
Stop: Below $345
⚠️ Bearish Case
* Break below $340 → Flush to $320 and possibly $315
* GEX puts will dominate under $320
Entry: Break and hold below $340
Target: $320, $315
Stop: Above $345
🧭 Trade Strategy Summary
* ⚔️ Inflection Zone: $340–$350 = Decision zone
* 🚀 Watch for gamma squeeze if $350+ holds
* 🛑 Breakdown below $340 flips bias bearish
* 🔄 Volume confirmation is key
Disclaimer: This analysis is for educational purposes only and does not constitute financial advice. Always do your own research and manage risk carefully.

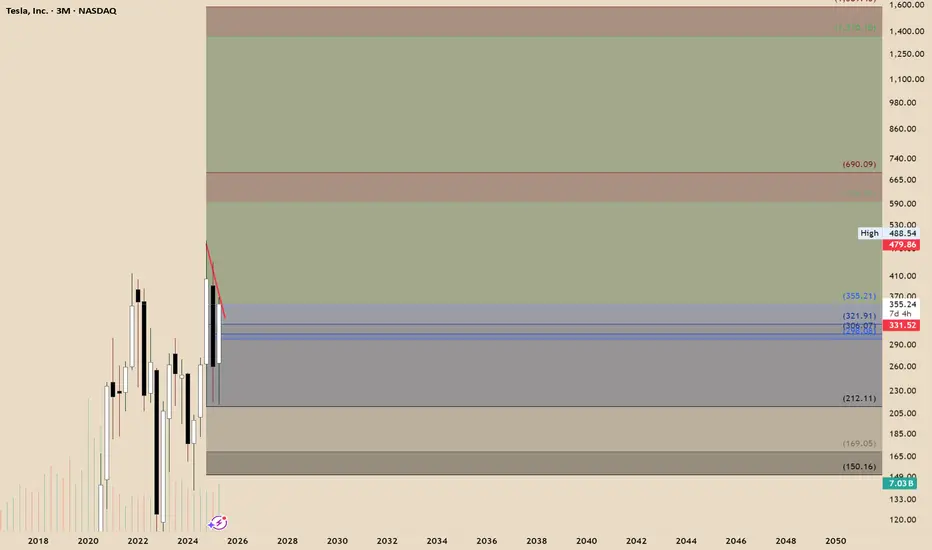
A Bullish Long-Term Outlook Tesla continues to present a compelling case for long-term investors, underpinned by its innovation-led growth trajectory and emerging dominance in autonomous mobility. Technically, recent market structure reveals an imbalance within a quarterly bullish breaker, suggesting further price expansion. If macroeconomic conditions remain favorable, the next algorithmic target zones fall between $594 and $690, signaling potential upside.
On the fundamental front, Tesla’s recent moves—particularly its rollout of the robotaxi network—have ignited fresh investor optimism. Analysts now estimate that autonomous driving could account for a substantial portion of Tesla’s future valuation, with some long-range forecasts placing the stock above $2,000 within the next several years.
While short-term pressures such as softening EV demand and regulatory barriers persist, Tesla’s consistent execution on AI-driven mobility may unlock new valuation territory.
Tesla: Robotaxi Hype and Breakout WatchNASDAQ:TSLA surged nearly +10% today, driven by growing anticipation around the upcoming robotaxi unveiling on August 8.
Investors are positioning early, speculating this innovation could open new revenue streams for Tesla and redefine mobility.
📊 Technical Setup:
• Price broke out of local resistance near $330
• Approaching major resistance at $370–371 (Bollinger Band + prior support)
• If $370 is broken and held, the stock could enter a new trading range: $370–$440
• RSI and Stochastic are heating up, but no signs of reversal yet
⚙️ Robotaxi Catalyst:
• Elon Musk confirmed the Robotaxi event set for August 8
• Analysts speculate this could boost valuation through AI and self-driving revenue potential
• Option volume and retail interest are rising fast
📌 Levels to watch:
• Breakout level: $370
• Target: $440
• Support zone: $330
• Invalidation: Close below $310
👀 Watch for pre-event momentum. A break above $370 could trigger a squeeze.

Tesla Rolls Out Much-Awaited Robotaxis. Buy or Sell the Stock?They’re here. After years of tweets, teasers, and timelines that aged like unrefrigerated dairy, Tesla NASDAQ:TSLA officially launched its long-awaited robotaxi service in Austin, Texas.
The self-driving revolution, we were told, would arrive like a lightning bolt. Instead, it quietly rolled up to the curb with a safety monitor riding shotgun.
On Sunday, ( as promised ) a small, highly curated fleet of Teslas — fully driverless, but not entirely unsupervised — began picking up paying passengers in an isolated section of Austin. CEO Elon Musk, as usual, led the cheer squad, declaring victory on X.
“Super congratulations to the Tesla AI software and chip design teams on a successful robotaxi launch!! Both the AI chip and software teams were built from scratch within Tesla.”
Investors, naturally, perked up. Tesla shares edged higher by more than 5% Monday morning as Wall Street tried to figure out whether this was the long-awaited catalyst for another rally… or just another “sell-the-news” moment that fizzles as quickly as the hype fades.
🔔 The Soft Launch Heard Around The Internet
Let’s not get carried away. This wasn’t a citywide revolution. Tesla’s launch was extremely limited — more of a PR exercise than a true market rollout. Only a handful of Teslas were involved, operating in a tightly controlled, geofenced area.
The riders? Carefully selected influencers, many of whom were more excited to film TikToks than analyze technical driving capability. In other words, this wasn’t exactly New York City rush-hour stress testing.
The rides cost a flat fee of $4.20, because, of course they did. And while the cars drove themselves, safety monitors sat in the front passenger seats — a very human reminder that the project is still very much in beta mode.
The bigger question for investors: Does this prove Tesla’s technology is ready for prime time? Or is it simply an appetizer served years before the main course?
📈 The Market Reaction: Buy the Rumor, Sell the Launch?
Here’s where things get tricky for traders.
The stock market, as always, is forward-looking. Tesla stock didn’t just wake up bullish on Monday because of a few rides in Austin — it’s been rallying for months because of the promise of robotaxis.
Since Tesla’s big October 10 robotaxi event — where Musk laid out plans to launch a self-driving cab service in 2025 — shares have climbed roughly 35%. Much of that gain is already baked into expectations for Tesla finally delivering on what Musk has been promising since at least 2016.
Now that the product is technically “live,” even in tiny demo form, some traders are wondering: is this the start of an even bigger rally?
The answer probably depends on how fast Tesla can scale. And that’s where reality gets stickier.
🤔 The Scaling Problem: A Long Road Ahead
As exciting as Sunday’s launch may have been for influencers and Tesla superfans, it’s not exactly proof of scalability. Deploying 10 carefully monitored cars in a tiny slice of Austin is one thing; blanketing entire metro areas, or states, or countries is another beast entirely.
Tesla’s AI software may be improving, and its in-house chip design gives it some vertical integration advantages. But scaling fully autonomous fleets will require navigating a minefield of regulatory, safety, and logistical challenges — not to mention stiff competition.
Alphabet’s Waymo is already operating robotaxi services in Phoenix, San Francisco, and Los Angeles, with years of public road testing under its belt. Cruise (General Motors) ran its own driverless service before recently pausing operations after high-profile safety incidents. The technology arms race is fierce — and far from settled.
Industry experts continue to caution that mass-market robotaxis may take years — if not decades — to fully materialize. And while Tesla loves to move fast and break things, cities, regulators, and insurance companies tend to prefer a bit more caution when thousands of driverless vehicles are involved.
📝 What’s Actually Priced Into Tesla Stock?
Here’s where this gets existential for Tesla bulls.
A huge chunk of Tesla’s market valuation — some would argue most of it — now rests on the idea that it isn’t just a car company. It’s an AI company. A software company. A robotics company. A future robotaxi empire. If those narratives start to weaken, so does the multiple.
Tesla remains dominant in EV production and it still benefits from profit margins (about half of the profits coming from selling regulatory credits to other carmakers). But even Musk himself has made clear that Tesla’s long-term valuation depends heavily on successfully delivering robotaxis and humanoid robots.
If Sunday’s soft launch is the start of something truly scalable, then maybe the valuation holds up. If it stalls — either due to regulatory hurdles, technological ceilings, or public skepticism — the market may need to reevaluate just how much of Tesla’s price reflects reality versus dreams.
👀 Bottom Line: Revolutionary or Just Another Test Ride?
So, should you buy or sell Tesla after its long-awaited robotaxi debut?
That depends on how you frame this moment. The bulls see a trillion-dollar industry being born, with Tesla perfectly positioned. The bears see a carefully staged PR event masking how far away true autonomy still is.
For now, Tesla gets credit for being bold — even if it’s bold enough to roll out a very small, very managed test.
But markets eventually ask: “What’s next?” And unless Tesla can quickly scale from 10 cars in Austin to fully functioning fleets in major cities, a victory lap here could feel a little premature.
As always with Tesla: the story is thrilling, the stock is volatile, and the future is still very much under construction.
And with its earnings just around the corner — you’re following the earnings calendar , right? — things might just be getting exciting.
Off to you : Which side are on? The bullish traders looking to add to their long positions or the bearish sellers who’ve been calling “overvalued” for years? Share your thoughts in the comments!

TSLA ready to head higherTSLA at the 200 SMA coming out of a sell off.... After the RoboTaxi debut, may get positive momentum to go higher ...

Bullish Setup Suggests Rally Towards $350 Zone
- T1 = $340.00
- T2 = $350.00
Stop Levels:
- S1 = $315.00
- S2 = $310.00
**Wisdom of Professional Traders:**
This analysis synthesizes insights from thousands of professional traders and market experts, leveraging collective intelligence to identify high-probability trade setups. The wisdom of crowds principle suggests that aggregated market perspectives from experienced professionals often outperform individual forecasts, reducing cognitive biases and highlighting consensus opportunities in Tesla.
**Key Insights:**
Tesla continues to receive robust interest as macroeconomic conditions favor growth-oriented companies, particularly in the electric vehicle sector. The recent earnings showed signs of stabilization in gross margins, thanks to operational efficiency and cost reductions. Similarly, the company's megapack energy storage segment is gaining traction, which provides an ancillary growth avenue outside its core vehicle business. Technical indicators suggest strong momentum, with Tesla's Relative Strength Index (RSI) approaching bullish levels while trading volume supports the ongoing price recovery.
Furthermore, global EV adoption continues to rise, with increased government support for sustainable energy initiatives securing Tesla's place as a leading player. Supply chain constrictions, previously a concern, are relaxing, providing tailwinds for smoother production cycles.
**Recent Performance:**
Tesla's stock has gained over 8% in the past two weeks, recovering from its support levels around $305. The recent breakout above $320 signals renewed buying interest, accompanied by increased institutional participation. Short-term volatility has brought manageable dips, but overall momentum indicates bullish consolidation towards higher highs in its near-term trading range.
**Expert Analysis:**
Market strategists highlight Tesla’s ability to outperform its competitors due to vertical integration, advanced battery technologies, and scaling of operational efficiencies. Technical analysts note Tesla hovering near an ascending triangle formation with breakout potential above $330. Analysts also observe robust support around $310, which acts as a safety net for downside risks. Moving averages, especially the 50-day and 200-day lines, are converging as they indicate sustained bullish sentiment.
**News Impact:**
Recent news regarding expanded production facilities in Europe and positive developments in autonomous driving technology have fueled optimism among investors. Further bolstering sentiment is CEO Elon Musk’s strategic focus on prioritizing volumes over short-term profit metrics—a move widely seen as prudent given the current competitive landscape in EV markets.
**Trading Recommendation:**
Tesla is primed for upside momentum and presents an attractive long opportunity for traders targeting $340 and $350 next price zones. Its technical and fundamental outlook support the bullish case as macroeconomic tailwinds and company-specific factors align for higher valuations. Focus on maintaining risk discipline by exiting trades if stops at $315 or $310 are breached. For patient investors, Tesla is likely to remain a candidate for continued capital appreciation.

TSLA: Anyone knows this powerful pattern?TSLA:
Anyone knows this powerful pattern?
The crowd gets lost in colorful indicators, forgetting that the market speaks clearly through just price and volume.
.
US STOCKS- WALL STREET DREAM- LET'S THE MARKET SPEAK!

Quick View: $TSLA
- Bullish Box on the daily chart supported by the ema50d and strong ema 21d and 9d. No volume on this box.
- Almost the same pattern on the hourly

$TSLA Short Trade – Breakdown in the Making “When pressure buil⚡🔻 💣📉
Tesla ( NASDAQ:TSLA ) is coiling tighter than ever inside this symmetrical triangle — but this isn’t strength… it’s stress.
With lower highs stacking and bulls running out of breath, the breakdown could hit like a spark in a lithium mine. ⚠️🔋
Is this just technicals? Or is the market doubting the Elon engine again? 🚗🧠
📌 Trade Setup:
Entry: $322.17
Target: $308.07
Stop-loss: $327.52
From breakout darling to breakdown candidate — Tesla’s chart is whispering a warning.
Will it hold… or will gravity take over? 🧲
#TSLA #ShortSetup #BearishChart #TeslaTrade #TradingViewSetup #ChartBreakdown #TechnicalAnalysis #OptionsPlay #ProfittoPath

Weekly Technical Analysis for TSLA (June 24–28)TSLA is entering a critical squeeze zone between major gamma walls and key price structure levels. Let’s break this down with both the Daily GEX Map and the 1-Hour Price Action to strategize your trades this week.
📊 GEX Map (Daily Timeframe Insights)
From the first chart:
* Current Price: $322.16
* High Gamma Resistance Zone:
* 🧱 $330 = GEX Cluster
* 🧱 $336–$342 = Highest NTE/Call Wall
* 🧱 $348–$367 = 2nd and 3rd CALL Walls
* Support Levels:
* 🛡️ $315 (2nd PUT Wall)
* 🛡️ $310 (3rd PUT Wall)
* 🔻 Below $310 = Gamma unwind and vacuum toward $296
GEX Sentiment:
* GEX: ✅ Bullish (green dot)
* IV Rank (IVR): 26.6 (low) → cheap options
* CALL$ flow: 59.3% bias bullish
* IVx < IVR → low IV crush risk on CALLs
Interpretation:
TSLA is pinned between two strong gamma zones: $315–$330. A breakout could magnet price quickly to $342+, but a breakdown below $312.50 puts $296 in play fast.
🕐 1-Hour Chart (Smart Money Concepts)
* CHoCH confirmed around $330 zone → bearish pressure
* BOS and reaccumulation near $312–$316 zone → short-term buyer defense
* Trendline support holding, price coiling in a wedge
* Volume shows weak conviction in breakdowns; potential trap under $315
🎯 Trade Scenarios for This Week
🔼 Bullish Setup (Breakout Above $330):
* Entry: Above $333 (confirm breakout + GEX flip)
* Target 1: $342 (GEX target, CALL wall)
* Target 2: $348–$357
* Stop: Below $322
* Trigger: Volume surge + clean CHoCH over pink zone
🔽 Bearish Setup (Breakdown Below $312):
* Entry: Below $311 (gap-filler move)
* Target 1: $296 (FVG + structure zone)
* Target 2: $284 (OB demand)
* Stop: Above $318
* Trigger: CHoCH failure + BOS retest fails under OB
🧠 Smart Tips
* If you’re scalping: watch the $322–$325 chop zone. Only commit on break of wedge.
* Gamma compression + low IV makes TSLA explosive this week—perfect for vertical debit spreads or lottos on direction breakout.
* Best confirmation = volume + higher timeframe CHoCH + breakout candle from consolidation.
🔚 Final Thoughts
TSLA is coiled tight. Watch for the breakout of $330 or a flush under $312. Both offer strong risk-to-reward opportunities. Stay patient, and let price confirm before sizing in.
Disclaimer: This analysis is for educational purposes only and does not constitute financial advice. Always do your own research and manage your risk properly.

$TSLA The Magnificent PennyWelcome to a comprehensive analysis of the little Penny Stock that could..
NASDAQ:TSLA is at it again, ripping shorts and trapping longs. Business as usual.
NASDAQ:TSLA operates primarily from one chart being the Hourly. All signals giveth and all Signal taketh away from this chart.
At present we are seeing a distinctive weakness creeping into the hourly chart which is presently in a distribution pattern making lower lows on it's consolidation. The trend is just starting to turn bearish and as you can see from our dynamic support and resistance levels, our first stop after already retesting resistance is a fill of the box at 316.14
Once this box is broken we can expect to fill the lower gap at 291.85 being a weekly support target.
Finally if a run back to the 265.13 Monthly target would complete the Market Maker discount to grab stock and push it higher from here.
All things being equal, NASDAQ:TSLA is a great short in the mid-term with both CCI and MA angle breaking to the downside.
