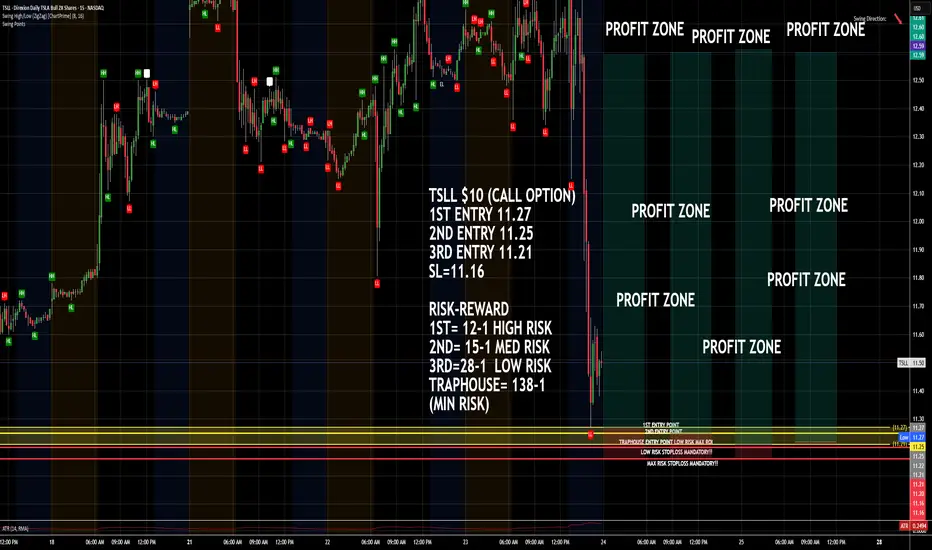
TSLL $10 CALL OPTIONIf price drops done into entry zone which is detailed on the chart, Enter the trade with a Call Option $10 or below!! Remember to set your stop loss!! Trap has potential!
P.S. If when market opens and share price doesnt drop but continue to rise from that point, then just enter in on a call and cr
Key stats
About Direxion Daily TSLA Bull 2X Shares
Home page
Inception date
Aug 9, 2022
Structure
Open-Ended Fund
Replication method
Synthetic
Dividend treatment
Distributes
Distribution tax treatment
Ordinary income
Income tax type
Capital Gains
Max ST capital gains rate
39.60%
Max LT capital gains rate
20.00%
Primary advisor
Rafferty Asset Management LLC
Distributor
Foreside Fund Services LLC
TSLL is a short-term tactical tool that aims to deliver 2x the price return, less fees and expenses, for a single day of Tesla stock. Purchasers holding shares for longer than a day will need to monitor and rebalance their position frequently to attempt to achieve the 2x multiple. Aside from the leverage, compared to traditional ETFs, the shares take on added volatility due to the lack of diversification. Purchasers should conduct their own individual stock research prior to initiating a position and trade with conviction. Due to the complexities of the product, shares tend to perform as anticipated only when the underlying shares are trending and holders are on the positive corresponding side of that trade. However, the shares provide the advantage of capping the maximum loss to the full amount invested. Prior to April 2, 2024, the fund was named Direxion Daily TSLA Bull 1.5X Shares, seeking to provide a 1.5x leverage exposure.
Related funds
Classification
What's in the fund
Exposure type
Consumer Durables
Cash
Stock breakdown by region
Top 10 holdings
2X Levered TESLA TSLL: $7.23 level since 2023Since 2023, when TSLL 2X levered Tesla hit $7.23 it tend s to see significant upside. The chart show the peak profit levels from the $7.23 level. I am waiting for it to drop below and then buy when price rises above the level. The horizonal arrows at the top show how many days it takes to hit the pe

Updated thoughtsThe chart speaks for itself. It’s going to go up then drop. Please lmk if yall have any other thoughts/ideas. Good luck traders!

TSLL Bull FlagNASDAQ:TSLL Holding up well — even with today’s market gap down, this TSLA ETF is maintaining strength and reclaiming ground. There's a key resistance around $16 that needs to be cleared before a potential move toward $20.

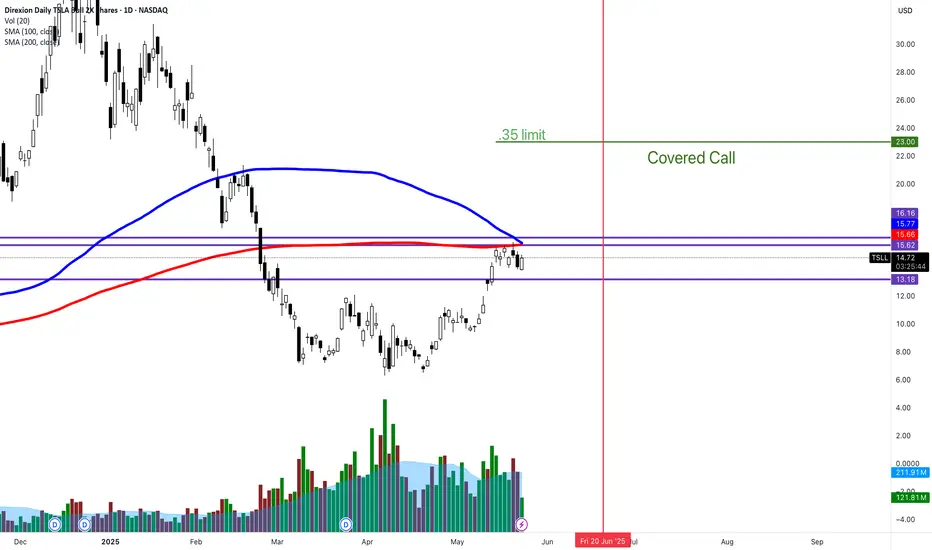
TSLL JUNE covered call What is REALLY cool about this covered call is
100/200 SMA acting as resistance. I'm getting 1.6% of premium. This CC is over 2 closed days in the market and it's $10 HIGHER than stock price?!?!
This is crazy. I love it.
Tesla Euphoria to Capitulation and Back AgainOver the past 12 months, Tesla’s price action reads like a three-act drama:
Euphoria (Nov ’24 – Dec ’24)
Rampant Breakout: After a multi-month range, TSLA erupted from low-20s to a peak near $42, driven by record deliveries and renewed growth optimism.
Blue Zone Strength: The blue-shaded sessions

If Tesla Bottoms Here TSLL x2 Leverage ETF Could Be The Play. These are tough markets but if macro economics settle out and bonds quit rolling up, I would bet on TSLA via TSLL to get maximum exposure. Not financial advice.

JM-CAPITAL – TSLL Stock Analysis | April 1, 2025
This is a monthly top-down analysis using trendlines and Fibonacci retracement from the low of $6.32 to the high of $41.40. I use trendlines to establish my directional bias and to map out key support and resistance zones. This method has consistently helped me identify strong entry points for opti

Trade Update for Mentorship Members $NVDA $TSLA $SPY $TSLLCaution around possible bear trap/liquidity sweep. Discussing support & resistance/Fib levels to watch. Discussing trade exits, and gameplan for trading today.

$TSLL – Major Reversal in Play? Is tesla finally back???
TSLL has been in a prolonged downtrend but is now showing signs of a potential bottoming pattern. Price recently tested a key support zone between $6.26 and $7.18, holding firmly after multiple attempts to break lower.
Current price action is forming a strong base, and th

See all ideas
Summarizing what the indicators are suggesting.
Oscillators
Neutral
SellBuy
Strong sellStrong buy
Strong sellSellNeutralBuyStrong buy
Oscillators
Neutral
SellBuy
Strong sellStrong buy
Strong sellSellNeutralBuyStrong buy
Summary
Neutral
SellBuy
Strong sellStrong buy
Strong sellSellNeutralBuyStrong buy
Summary
Neutral
SellBuy
Strong sellStrong buy
Strong sellSellNeutralBuyStrong buy
Summary
Neutral
SellBuy
Strong sellStrong buy
Strong sellSellNeutralBuyStrong buy
Moving Averages
Neutral
SellBuy
Strong sellStrong buy
Strong sellSellNeutralBuyStrong buy
Moving Averages
Neutral
SellBuy
Strong sellStrong buy
Strong sellSellNeutralBuyStrong buy
Displays a symbol's price movements over previous years to identify recurring trends.
Frequently Asked Questions
An exchange-traded fund (ETF) is a collection of assets (stocks, bonds, commodities, etc.) that track an underlying index and can be bought on an exchange like individual stocks.
TSLL trades at 11.27 USD today, its price has risen 6.93% in the past 24 hours. Track more dynamics on TSLL price chart.
TSLL net asset value is 11.29 today — it's fallen 9.25% over the past month. NAV represents the total value of the fund's assets less liabilities and serves as a gauge of the fund's performance.
TSLL assets under management is 5.96 B USD. AUM is an important metric as it reflects the fund's size and can serve as a gauge of how successful the fund is in attracting investors, which, in its turn, can influence decision-making.
TSLL price has fallen by −18.27% over the last month, and its yearly performance shows a 8.47% increase. See more dynamics on TSLL price chart.
NAV returns, another gauge of an ETF dynamics, have risen by −9.25% over the last month, have fallen by −9.25% over the last month, showed a 8.55% increase in three-month performance and has increased by 13.28% in a year.
NAV returns, another gauge of an ETF dynamics, have risen by −9.25% over the last month, have fallen by −9.25% over the last month, showed a 8.55% increase in three-month performance and has increased by 13.28% in a year.
TSLL fund flows account for 4.64 B USD (1 year). Many traders use this metric to get insight into investors' sentiment and evaluate whether it's time to buy or sell the fund.
Since ETFs work like an individual stock, they can be bought and sold on exchanges (e.g. NASDAQ, NYSE, EURONEXT). As it happens with stocks, you need to select a brokerage to access trading. Explore our list of available brokers to find the one to help execute your strategies. Don't forget to do your research before getting to trading. Explore ETFs metrics in our ETF screener to find a reliable opportunity.
TSLL invests in cash. See more details in our Analysis section.
TSLL expense ratio is 0.95%. It's an important metric for helping traders understand the fund's operating costs relative to assets and how expensive it would be to hold the fund.
Yes, TSLL is a leveraged ETF, meaning it uses borrowings or financial derivatives to magnify the performance of the underlying assets or index it follows.
In some ways, ETFs are safe investments, but in a broader sense, they're not safer than any other asset, so it's crucial to analyze a fund before investing. But if your research gives a vague answer, you can always refer to technical analysis.
Today, TSLL technical analysis shows the sell rating and its 1-week rating is sell. Since market conditions are prone to changes, it's worth looking a bit further into the future — according to the 1-month rating TSLL shows the sell signal. See more of TSLL technicals for a more comprehensive analysis.
Today, TSLL technical analysis shows the sell rating and its 1-week rating is sell. Since market conditions are prone to changes, it's worth looking a bit further into the future — according to the 1-month rating TSLL shows the sell signal. See more of TSLL technicals for a more comprehensive analysis.
Yes, TSLL pays dividends to its holders with the dividend yield of 3.74%.
TSLL trades at a premium (0.16%).
Premium/discount to NAV expresses the difference between the ETF’s price and its NAV value. A positive percentage indicates a premium, meaning the ETF trades at a higher price than the calculated NAV. Conversely, a negative percentage indicates a discount, suggesting the ETF trades at a lower price than NAV.
Premium/discount to NAV expresses the difference between the ETF’s price and its NAV value. A positive percentage indicates a premium, meaning the ETF trades at a higher price than the calculated NAV. Conversely, a negative percentage indicates a discount, suggesting the ETF trades at a lower price than NAV.
TSLL shares are issued by Rafferty Asset Management LLC
TSLL follows the Tesla, Inc.. ETFs usually track some benchmark seeking to replicate its performance and guide asset selection and objectives.
The fund started trading on Aug 9, 2022.
The fund's management style is passive, meaning it's aiming to replicate the performance of the underlying index by holding assets in the same proportions as the index. The goal is to match the index's returns.