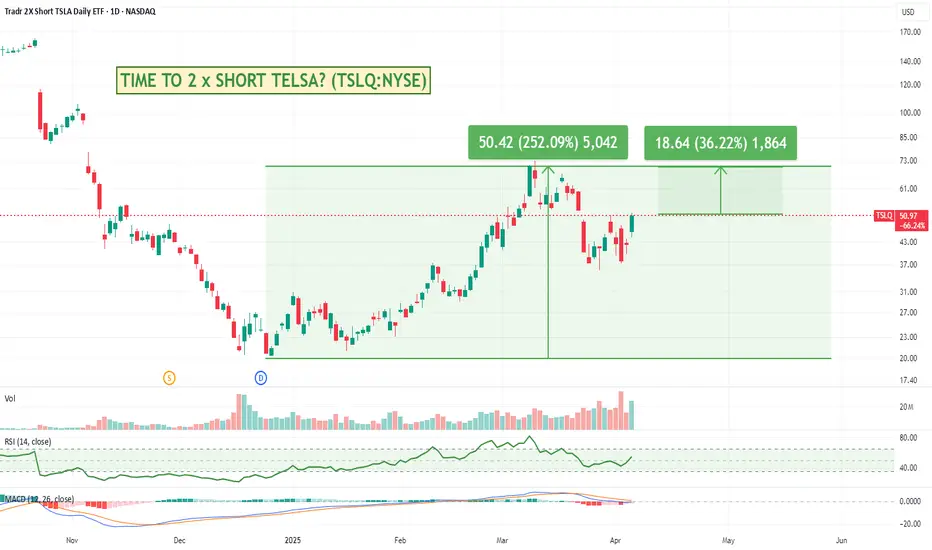
Is it time to short Tesla? If so TSLQ might be of interest.Tesla's ongoing turbulence is getting harder and harder to ignore even amongst some of the permabulls. Notably, Wedbush Securities' Dan Ives, a long-time Tesla bull, recently slashed his 12-month price target by a whopping 43% reduction noting concerns over CEO Elon Musk's political entanglements an
Key stats
About Tradr 2X Short TSLA Daily ETF
Home page
Inception date
Jul 13, 2022
Structure
Open-Ended Fund
Replication method
Synthetic
Dividend treatment
Distributes
Distribution tax treatment
Ordinary income
Income tax type
Capital Gains
Max ST capital gains rate
39.60%
Max LT capital gains rate
20.00%
Primary advisor
AXS Investments LLC
Distributor
ALPS Distributors, Inc.
TSLQ is a short-term tactical tool that aims to deliver -2x the price return, less fees and expenses, for a single day of Tesla stock. Purchasers holding shares for longer than a day will need to monitor and rebalance their position frequently to attempt to achieve the -2x multiple. Aside from the inverse exposure, the shares take on added volatility due to the lack of diversification. Purchasers should conduct their own individual stock research prior to initiating a position and trade with conviction. Due to the complexities of the product, shares tend to perform as anticipated only when the underlying shares are trending and holders are on the positive corresponding side of that trade. However, the shares provide the advantage of capping the maximum loss to the full amount invested. On May 15, 2024, the fund changed its name from AXS TSLA Bear Daily ETF to Tradr TSLA Bear Daily ETF. The fund changed its name again on July 15, 2024, to Tradr 2X Short TSLA Daily ETF.
Related funds
Classification
What's in the fund
Exposure type
Cash
Miscellaneous
Bonds, Cash & Other100.00%
Cash82.64%
Miscellaneous17.36%
Top 10 holdings
TSLQ/USD – 30-Min Short Trade Setup!📌 📉
🔹 Asset: TSLQ (Tradr 2X Short TSLA Daily ETF)
🔹 Timeframe: 30-Min Chart
🔹 Setup Type: Bearish Breakdown Trade
📌 Trade Plan (Short Position)
✅ Entry Zone: Below $41.50 (Breakdown Confirmation)
✅ Stop-Loss (SL): Above $44.73 (Break of Resistance & Trendline)
🎯 Take Profit Targets
📌 TP1: $38.79

TSLQ from $14.06 to $20MODs have suggested that I provide more detail about the picks I make.
Sorry. I'm not as verbose as y'all, and I don't like things to be complicated.
My trading plan is very simple.
I buy or sell at top & bottom of parallel channels.
I confirm when price hits Fibonacci levels.
Bonus if a TTM Sq

$TSLQ - Range BoundTSLQ is an ETF that bets against Tesla ( NASDAQ:TSLA ) and has been trading within a certain range for nearly 10 months. It is worth keeping an eye on this ETF as it may potentially break out to the upside. Although I have invested in NASDAQ:TSLA shares, I would use NASDAQ:TSLQ as a hedge for my

**TSLA Short ETF** $TSLQ Daily Chart (Bearish Scenario) **TSLA Short ETF**
NASDAQ:TSLQ Daily Chart (Bearish Scenario) : For educational purposes only, NFA.
#1: Price below daily 9 EMA
#2: Daily forming Bearish expanding triangle, which is bearish reversal pattern.
#3: Bearish Divergence on daily RSI, which is also a reversal signal.

$TSLQ - $13.95 Short Term Technical PTMassive bearish Head AND Shoulder formation with a crack below neckline. length of head to neckline = projected drop to downside. Technical Price Target of around $13.95.

TSLQ | Tesla Bear ETF | LONGUnder normal market circumstances, the adviser will maintain at least 80% exposure to financial instruments that provide inverse exposure to the daily performance of TSLA. The fund is an actively-managed exchange-traded fund ("ETF") that seeks to achieve on a daily basis, before fees and expenses, -

See all ideas
Summarizing what the indicators are suggesting.
Oscillators
Neutral
SellBuy
Strong sellStrong buy
Strong sellSellNeutralBuyStrong buy
Oscillators
Neutral
SellBuy
Strong sellStrong buy
Strong sellSellNeutralBuyStrong buy
Summary
Neutral
SellBuy
Strong sellStrong buy
Strong sellSellNeutralBuyStrong buy
Summary
Neutral
SellBuy
Strong sellStrong buy
Strong sellSellNeutralBuyStrong buy
Summary
Neutral
SellBuy
Strong sellStrong buy
Strong sellSellNeutralBuyStrong buy
Moving Averages
Neutral
SellBuy
Strong sellStrong buy
Strong sellSellNeutralBuyStrong buy
Moving Averages
Neutral
SellBuy
Strong sellStrong buy
Strong sellSellNeutralBuyStrong buy
Displays a symbol's price movements over previous years to identify recurring trends.
Frequently Asked Questions
An exchange-traded fund (ETF) is a collection of assets (stocks, bonds, commodities, etc.) that track an underlying index and can be bought on an exchange like individual stocks.
TSLQ trades at 14.72 USD today, its price has fallen −5.66% in the past 24 hours. Track more dynamics on TSLQ price chart.
TSLQ net asset value is 14.86 today — it's fallen 17.98% over the past month. NAV represents the total value of the fund's assets less liabilities and serves as a gauge of the fund's performance.
TSLQ assets under management is 332.65 M USD. AUM is an important metric as it reflects the fund's size and can serve as a gauge of how successful the fund is in attracting investors, which, in its turn, can influence decision-making.
TSLQ price has fallen by −21.06% over the last month, and its yearly performance shows a −93.06% decrease. See more dynamics on TSLQ price chart.
NAV returns, another gauge of an ETF dynamics, have fallen by −17.98% over the last month, showed a −29.27% decrease in three-month performance and has decreased by −92.55% in a year.
NAV returns, another gauge of an ETF dynamics, have fallen by −17.98% over the last month, showed a −29.27% decrease in three-month performance and has decreased by −92.55% in a year.
TSLQ fund flows account for 602.76 M USD (1 year). Many traders use this metric to get insight into investors' sentiment and evaluate whether it's time to buy or sell the fund.
Since ETFs work like an individual stock, they can be bought and sold on exchanges (e.g. NASDAQ, NYSE, EURONEXT). As it happens with stocks, you need to select a brokerage to access trading. Explore our list of available brokers to find the one to help execute your strategies. Don't forget to do your research before getting to trading. Explore ETFs metrics in our ETF screener to find a reliable opportunity.
TSLQ invests in cash. See more details in our Analysis section.
TSLQ expense ratio is 1.17%. It's an important metric for helping traders understand the fund's operating costs relative to assets and how expensive it would be to hold the fund.
TSLQ is an inverse fund, meaning it's structured to generate returns opposite to the trends of the underlying index or assets.
In some ways, ETFs are safe investments, but in a broader sense, they're not safer than any other asset, so it's crucial to analyze a fund before investing. But if your research gives a vague answer, you can always refer to technical analysis.
Today, TSLQ technical analysis shows the sell rating and its 1-week rating is sell. Since market conditions are prone to changes, it's worth looking a bit further into the future — according to the 1-month rating TSLQ shows the sell signal. See more of TSLQ technicals for a more comprehensive analysis.
Today, TSLQ technical analysis shows the sell rating and its 1-week rating is sell. Since market conditions are prone to changes, it's worth looking a bit further into the future — according to the 1-month rating TSLQ shows the sell signal. See more of TSLQ technicals for a more comprehensive analysis.
Yes, TSLQ pays dividends to its holders with the dividend yield of 8.92%.
TSLQ trades at a premium (0.12%).
Premium/discount to NAV expresses the difference between the ETF’s price and its NAV value. A positive percentage indicates a premium, meaning the ETF trades at a higher price than the calculated NAV. Conversely, a negative percentage indicates a discount, suggesting the ETF trades at a lower price than NAV.
Premium/discount to NAV expresses the difference between the ETF’s price and its NAV value. A positive percentage indicates a premium, meaning the ETF trades at a higher price than the calculated NAV. Conversely, a negative percentage indicates a discount, suggesting the ETF trades at a lower price than NAV.
TSLQ shares are issued by SR Partners LLC
TSLQ follows the Tesla, Inc.. ETFs usually track some benchmark seeking to replicate its performance and guide asset selection and objectives.
The fund started trading on Jul 13, 2022.
The fund's management style is passive, meaning it's aiming to replicate the performance of the underlying index by holding assets in the same proportions as the index. The goal is to match the index's returns.