TTD at multi month supportTTD has been beat to pieces the past month. However we have just reached a multi month support which could present a short term bounce
TTD trade ideas

TTD - bought for a bounceSeems that nothing changed with the company fundamentals. Simply too oversold. Buying for a bounce.
Gap Filled, now what?Election spending sent earnings and the stock price to extremely exaggerated valuations. Now that the stock has been pummeled, what will be the next major driver for growth for this Wall St darling? They need to watch over their shoulder as AppLovin is looking to mount a challenge.
We are approaching an area of support, along with a gap being filled at $77. I'm watching the reaction at support, not trying to catch a falling knife. If the overall market tanks, this could continue to drop like a rock. So if I do trade this, I will keep a tight stop loss.
Not financial advice, do what's best for you.

$TTD - highly oversold here bounce to $85 incoming NASDAQ:TTD stock is down almost 50% since highs hitting 52 week lows on Friday. $70 looks a levels that it needs to hold and looks oversold at these levels. Looking for oversold bounce here as long as $70 holds for a move towards $76 and $85. Stock has a huge earnings gap above it


TTD: failed bullish setup = strong bearish moveFailed bullish formations become strong bearish moves. The proportional range to forecast a bullish break above the base becomes the forecast for a the low of the failure. Someday I'll see one of these in time for a massive short.
Note that the forecast is in between the 1.272 and 1.414 of a fib retrace anchored to a momentum crossover. They are also nearly aligned to the two AVWAPs that hand off from TTD's IPO. The middle marks the covid low.
The composite index is at a lower reading, but not an extreme that would mark a bottom. The detrended price oscillator is at it's lowest reading. Extremes can mark a bottom, but a higher low on the oscillator would give confirmation.

TTD LONG SET UPEntry 1 $75.00
Entry 2 $72.50
Stop loss $60.00
Take profit 1- $85.00
(Close 33%)
Take profit 2- $97.50
(Close 66%)
Take profit 3-$115.00
(Close 100%)

THE TRADE DESK BUY OPPORTUNITYThe earlier level now in hindsight was a weak demand zone which was broken. we are approaching the next significant demand zone which price can start the next bullish phase. Target previous all time high.
Good luck

Im loving $TTD down here in this demand zone on the DailyIf you see this then give me a boost. I think this a good area to buy shares or get some calls 2 to 3 month out

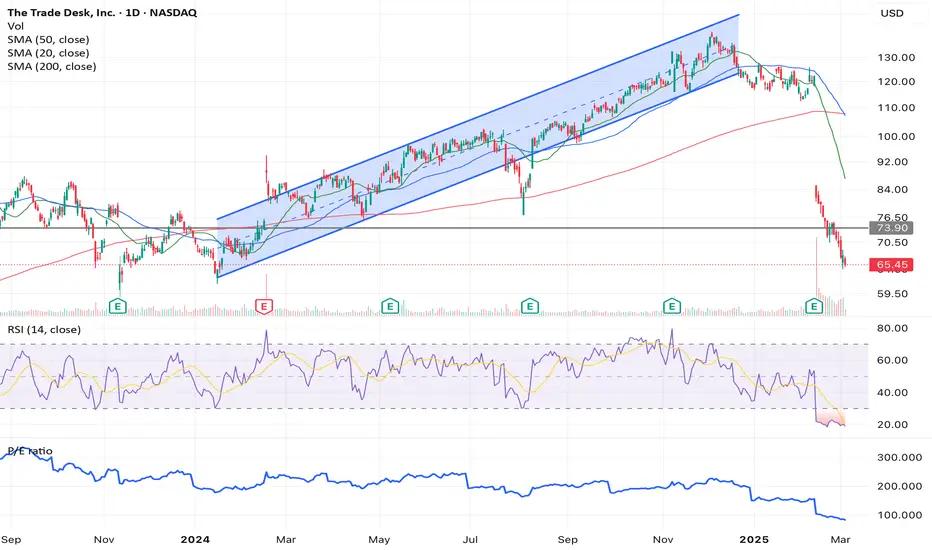
TTD, where do we go from here?A significant sell-off in The Trade Desk (TTD) followed its earnings report, driving the price toward a critical technical zone. The 76.45 - 80.16 range has historically acted as a strong support area, with multiple price interactions suggesting institutional buying interest in the past.
If the price holds this zone as support and RSI begins to recover, a potential bounce toward the 96.50 resistance level could occur. Price action at in this zone will be key—if buyers step in, a short-term rebound may follow. However, a break below 76 with rising volume could indicate further downside, potentially leading to lower support levels.
Disclaimer:
This analysis is for educational purposes only and should not be considered financial advice. Trading and investing involve risk, and independent research or consultation with a professional is recommended before making any financial decisions.

BUY THE TRADE DESKThis is a market opportunity for us to buy The Trade Desk at a discount. Expecting this to keep setting all time highs so lets take advantage of this and ride the wave.
Good Luck

Contrarian Post Earnings Play with 20%+ upside potentialHuge sell-off post earnings. Market overreacted after a great year for TTD. Technically the sell-off can not be supported. When RSI was in such levels before, stock bounced back. Accumulation/Distribution Index is on the rise, meaning that we might have a positive divergence. Personally, it is the first time opening a long position in TTD. My entry was at $82.96. First resistance level is at $91 and second one is at $100. I will consider a partial close of my position at the $100 mark.
Wishing all of you sharp instincts, steady hands, and plenty of green days ahead! May your charts be clear, your entries precise, and your profits abundant. 🚀📈

TTD to $120My trading plan is very simple.
I buy or sell when price tags the top or bottom of parallel channels.
I confirm when price hits Fibonacci levels.
So...
Here's why I'm picking this symbol to do the thing.
Price in channel zones at bottom of channels (period 100 & 26)
Stochastic Momentum Index (SMI) at oversold level
VBSM is spiked negative and under at bottom of Bollinger Band
Entry at $113.78
Target is $120 or channel top

TTD dip maybe comingTTD has earning coming soon. I see an opportunity starting to present itself. After a 5 year consolidation the stock has broken out and i believe the retest is in the process of happening. Two levels that stand out to me are $103 and $90. The 30 month moving average lines up with the $90 area. I'm not going to be trying to snipe the bottom here. The upside this company has is immense and would be happy to add around either of these 2 areas.

Bullish Trend Confirmed for TTD - Maintain Stop Loss at 111.19NASDAQ:TTD The stock of TTD is currently showing a strong bullish trend. It's advisable to keep your stop loss at 111.19 to manage risk, while the price remains below 150. This strategy should help in securing profits while protecting against significant downturns. Keep an eye on the resistance levels as we approach higher price points.

$TTD - Head and shouldersNASDAQ:TTD is forming head and shoulders pattern. If it breaks below the neckline area it could drop to $109 to $106 area.
As always, I share my opinions and trades. I'm not suggesting anyone follow my trades. You do you.

Stock Market Logic Series #13The double bottom and double top patterns are among the most powerful and reliable indicators in technical analysis. These formations provide traders with insights into potential trend reversals, making them valuable tools in a trader's arsenal. However, one must approach these patterns with patience and discipline to truly harness their power.
Statistically, the price often does not move decisively on the first attempt, and waiting for confirmation can significantly improve the likelihood of a successful trade entry.
A double bottom pattern occurs when a stock's price hits a low point, rebounds, and then retests the same low point before moving upward. This pattern suggests that the selling pressure is diminishing, and buyers are starting to take control. Conversely, a double-top pattern forms when the price reaches a high point, retraces, and then retests the same high point before moving downward. This indicates that buying pressure is waning, and sellers are gaining the upper hand.
One of the key aspects of trading these patterns is patience. It's essential to wait for the price to confirm the pattern before entering a trade. For a double bottom, this means waiting for the price to break above the resistance level formed between the two lows. For a double top, it involves waiting for the price to break below the support level formed between the two highs. By waiting for these confirmations, traders can avoid false signals and increase their chances of entering a profitable trade. This is because you will not fall into the trap of HINDSIGHT backtesting and it is clear that an M or W happened.
HINDSIGHT backtesting is that you have the hindsight advantage when you backtest, but you don't have it when you do REAL-TIME trading.
FYI, TradingView gives you the ability to do a reply of bars ... This gives you the dramatic advantage of seeing if your trading rules are REAL-TIME approved.
Patience is particularly crucial because, statistically, the price often makes multiple attempts to break through these key levels. Impatient traders who jump in too early may find themselves caught in a false breakout or worse an "imaginary breakout", resulting in losses. By waiting for the price to confirm the pattern, traders can ensure that the trend reversal is genuine and increase their odds of success.
Imaginary breakout is when you imagine the price will do what you believe it will do, and it never does it. This cognitive error causes you to enter trades you would have never taken when you backtested your strategy.
John Bollinger, the creator of the Bollinger Bands, recognizes the power of double bottom and double top patterns. Bollinger Bands are a popular technical analysis tool that measures market volatility and provides a dynamic range within which prices are likely to move. When combined with double bottom and double top patterns, Bollinger Bands can further enhance a trader's decision-making process.
TradingView also functions as the best Trading Journal , I have my whole series of stock market logic ideas which I always refer back to. Also, you can add inside the journal idea a picture of the chart that is automatically stored and displayed on the TradingView ideas.
What you see on the chart is a confirmed validated M-pattern (the pink is the manifestation of the pattern), then after it you see a period of "NOT LONG".
This gives you a "TELL" that the probability of the rallies... they are fake.
Then, you see a confirmed W-pattern (the pink is the manifestation of the pattern), then after it, you see a period of "LONG".
This gives you a "TELL" that the probability of the corrections... they are fake.
When YOU, yes YOU, "KNOWS" statistically, when a fake pricing happens... this is a very lucrative business opportunity...

TTD potential 100MA bounce. Market doesn't look great so far in 2025 and last week of 2024. But if we bounce, TTD is sitting on a nice support and could make it up towards the 126, which is 50MA. Would give it a tight stop. In case selling continues.


New Setup: TTDTTD : I have a swing trade setup signal. I'm looking to enter long if the stock can manage to CLOSE above the last candle high(BUY). If triggered, I will then place a stop-loss below (SL) and a price target above it(TP-50%,move SL to breakeven), then using the close below the 10SMA as my trailing stop loss. **Note: The above setups will remain valid until the stock CLOSES BELOW my set stop-loss level(SL).

$TTD - Flat top breakoutTTD - Stock broke new all time highs on daily time frame. Stock broke FLAT top at $132.50. Looking for calls as long as $135 holds. Price target of $140 and $150. Stock is strong on indicators. $135 support needs to hold

$TTD - Possible double top breakout above $132.5TTD - Stock bouncing between $132.50 and $116. making double top and double bottom. looking for calls above $132.57 or back down below $130 for a move back to $116. Stock is strong on indicator. on high watch. ABove $132.5 we can see $145 and higher.

$TTD - trendline breakdown to the downside. TTD - Stock breaking below trendline support and looking to pull down. Company reported earnings recently. looking for puts below $116 for a move towards $110 and $100. Stock is weak on indicators.
