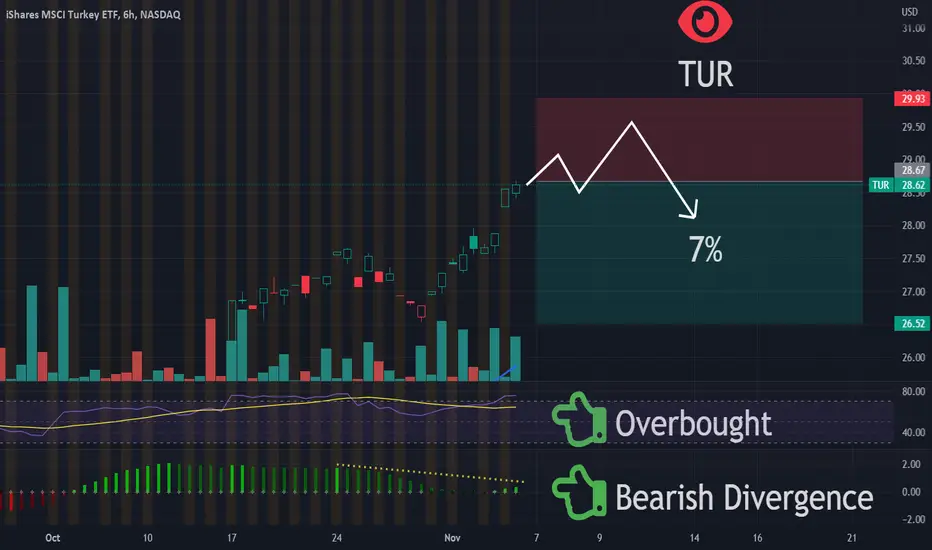
Not enough lows amid friction dense marketsRate of return is still bullish but rate of friction is bearish. This lead to stronger bearish market to normalize returns.
Key stats
About iShares MSCI Turkey ETF
Home page
Inception date
Mar 26, 2008
Structure
Open-Ended Fund
Replication method
Physical
Dividend treatment
Distributes
Distribution tax treatment
Qualified dividends
Income tax type
Capital Gains
Max ST capital gains rate
39.60%
Max LT capital gains rate
20.00%
Primary advisor
BlackRock Fund Advisors
Distributor
BlackRock Investments LLC
TUR offers a pure play take on Turkish equities. It tracks our market-cap-weighted index, which invests in large-, mid, and small-cap companies trading in the Istanbul Stock Exchange (ISE), providing comprehensive exposure to the market. Overall, TUR is as good a proxy as one can get for the Turkish stock market. However, investors must still be conscious of the funds composition before investing, as the pool of Turkish companies may result in high concentration risk among some specific sectors. The fund uses a sampling strategy, meaning the fund may not hold all the stocks of the underlying index but will hold securities that collectively have the same investment profile. The index is rebalanced quarterly.
Related funds
Classification
What's in the fund
Exposure type
Finance
Retail Trade
Stock breakdown by region
Top 10 holdings

Target 69.71After 10 years drop and elections confirmations, it's ready to go.
TP1 37.98
TP2 69.71
SL 100 EMA weekly can be followed.

TUR UpdateTUR finally broke yesterday and rebounded today.
Thing is, when stuff goes parabolic they drop just as fast. Bought a few puts today for kicks and giggles. Not a sure bet but nothing is right now, lol

Turkey ETF bullishFollowing monthly chart.
TURKEY ETF got confirmation both in chart and RSI indicator.
TP1 28.21
TP2 37.98
SL 17.80 - please wait for monthly candle close.

TUR UpdateCrazy crap, Turkey rallied again today.
Looking to buy puts next week, getting close to the resistance zone. Plus FDAX is almost overbought on short term charts.

IS November time for Turkey?Watching the weekly moving averages on Turkey. Nice above so can it hold or break!

TUR | Put Options Anyone? | ShortThe fund generally will invest at least 80% of its assets in the component securities of the underlying index and in investments that have economic characteristics that are substantially identical to the component securities of the underlying index. The underlying index is designed to measure the pe
TURdShorting Turkey via TUR ETF.
I think the currency tanks faster than they can pump their market, lol. At he resistance area anyways, so worth a shot. Overbought on daily RSI

TUR - setting up for something more?TUR has been in a sideways consolidation since mid 2018. In Dec 2021 (3rd week of month), demand showed up in a major after washing out and springing the multi year lows (08/18, 3/20, 10/20). This was was the widest spread bar, on the highest volume in this multi consolidation since the climactic

$TUR Turkey bullish breakoutNice breakout here on Turkey ETF TUR and close above 30week MA
I'm long shares
Technically looks like Wyckoff accumulation pattern with "Spring" action in DEC and now entering phase D
Expect a little LPS pullback , but I remain bullish above 20 zone.
First target 24 zone, implies 30 , and a

See all ideas
Summarizing what the indicators are suggesting.
Oscillators
Neutral
SellBuy
Strong sellStrong buy
Strong sellSellNeutralBuyStrong buy
Oscillators
Neutral
SellBuy
Strong sellStrong buy
Strong sellSellNeutralBuyStrong buy
Summary
Neutral
SellBuy
Strong sellStrong buy
Strong sellSellNeutralBuyStrong buy
Summary
Neutral
SellBuy
Strong sellStrong buy
Strong sellSellNeutralBuyStrong buy
Summary
Neutral
SellBuy
Strong sellStrong buy
Strong sellSellNeutralBuyStrong buy
Moving Averages
Neutral
SellBuy
Strong sellStrong buy
Strong sellSellNeutralBuyStrong buy
Moving Averages
Neutral
SellBuy
Strong sellStrong buy
Strong sellSellNeutralBuyStrong buy
Displays a symbol's price movements over previous years to identify recurring trends.
Frequently Asked Questions
An exchange-traded fund (ETF) is a collection of assets (stocks, bonds, commodities, etc.) that track an underlying index and can be bought on an exchange like individual stocks.
TUR trades at 33.92 USD today, its price has risen 0.21% in the past 24 hours. Track more dynamics on TUR price chart.
TUR net asset value is 34.06 today — it's risen 4.57% over the past month. NAV represents the total value of the fund's assets less liabilities and serves as a gauge of the fund's performance.
TUR assets under management is 168.61 M USD. AUM is an important metric as it reflects the fund's size and can serve as a gauge of how successful the fund is in attracting investors, which, in its turn, can influence decision-making.
TUR price has risen by 2.98% over the last month, and its yearly performance shows a −19.94% decrease. See more dynamics on TUR price chart.
NAV returns, another gauge of an ETF dynamics, showed a 11.90% increase in three-month performance and has decreased by −16.57% in a year.
NAV returns, another gauge of an ETF dynamics, showed a 11.90% increase in three-month performance and has decreased by −16.57% in a year.
TUR fund flows account for −33.70 M USD (1 year). Many traders use this metric to get insight into investors' sentiment and evaluate whether it's time to buy or sell the fund.
Since ETFs work like an individual stock, they can be bought and sold on exchanges (e.g. NASDAQ, NYSE, EURONEXT). As it happens with stocks, you need to select a brokerage to access trading. Explore our list of available brokers to find the one to help execute your strategies. Don't forget to do your research before getting to trading. Explore ETFs metrics in our ETF screener to find a reliable opportunity.
TUR invests in stocks. See more details in our Analysis section.
TUR expense ratio is 0.59%. It's an important metric for helping traders understand the fund's operating costs relative to assets and how expensive it would be to hold the fund.
No, TUR isn't leveraged, meaning it doesn't use borrowings or financial derivatives to magnify the performance of the underlying assets or index it follows.
In some ways, ETFs are safe investments, but in a broader sense, they're not safer than any other asset, so it's crucial to analyze a fund before investing. But if your research gives a vague answer, you can always refer to technical analysis.
Today, TUR technical analysis shows the strong buy rating and its 1-week rating is buy. Since market conditions are prone to changes, it's worth looking a bit further into the future — according to the 1-month rating TUR shows the buy signal. See more of TUR technicals for a more comprehensive analysis.
Today, TUR technical analysis shows the strong buy rating and its 1-week rating is buy. Since market conditions are prone to changes, it's worth looking a bit further into the future — according to the 1-month rating TUR shows the buy signal. See more of TUR technicals for a more comprehensive analysis.
Yes, TUR pays dividends to its holders with the dividend yield of 1.80%.
TUR trades at a premium (0.42%).
Premium/discount to NAV expresses the difference between the ETF’s price and its NAV value. A positive percentage indicates a premium, meaning the ETF trades at a higher price than the calculated NAV. Conversely, a negative percentage indicates a discount, suggesting the ETF trades at a lower price than NAV.
Premium/discount to NAV expresses the difference between the ETF’s price and its NAV value. A positive percentage indicates a premium, meaning the ETF trades at a higher price than the calculated NAV. Conversely, a negative percentage indicates a discount, suggesting the ETF trades at a lower price than NAV.
TUR shares are issued by BlackRock, Inc.
TUR follows the MSCI Turkey IMI 25-50. ETFs usually track some benchmark seeking to replicate its performance and guide asset selection and objectives.
The fund started trading on Mar 26, 2008.
The fund's management style is passive, meaning it's aiming to replicate the performance of the underlying index by holding assets in the same proportions as the index. The goal is to match the index's returns.