Long at 138.26 -- TW trades up short term, imoLike my UBER idea from yesterday, TW doesn't have a long enough track record for my to "officially" rank it among the stocks I trade, but also like UBER has produced excellent results during its albeit relatively brief history.
Its record with my algo is 158-1 (the one "loss" is from a signal gene
Next report date
—
Report period
—
EPS estimate
—
Revenue estimate
—
2.62 USD
501.12 M USD
1.73 B USD
115.83 M
About Tradeweb Markets Inc.
Sector
Industry
CEO
William Hult
Website
Headquarters
New York
Founded
1996
FIGI
BBG00NK8H8T2
Tradeweb Markets, Inc. engages in the operation of electronic marketplaces for the trading of products across the rates, credit, money markets, and equities asset classes. It also provides related pre-trade pricing and post-trade processing services. Its network comprises clients across the institutional, wholesale, and retail client sectors, including global asset managers, hedge funds, insurance companies, central banks, banks and dealers, proprietary trading firms and retail brokerage and financial advisory firms, as well as regional dealers. The company was founded by Lee Olesky in 1996 and is headquartered in New York, NY.
Related stocks

TW: Looking ForwardFundamentals:
Tradeweb's industry strength is good. Both its sales and earnings are accelerating, and both are estimated to continue this way until the end of 2024, and both are above 20%. I checked the funds; they are piling in.
Technicals:
It is now forming a weekly flat base at the all-time-

TW Short 12/11/23NASDAQ:TW
Tradeweb Markets is set to begin a major bear market against the 102.33 high following the completion of a double zigzag. Prices should begin to develop impulsively towards and through at least the 78.75 low against 102.33. Much greater bearish potential exists.

$TW with a bearish outlook following its earnings #Stocks The PEAD projected a bearish outlook for $TW after a positive over reaction following its earnings release placing the stock in drift B.

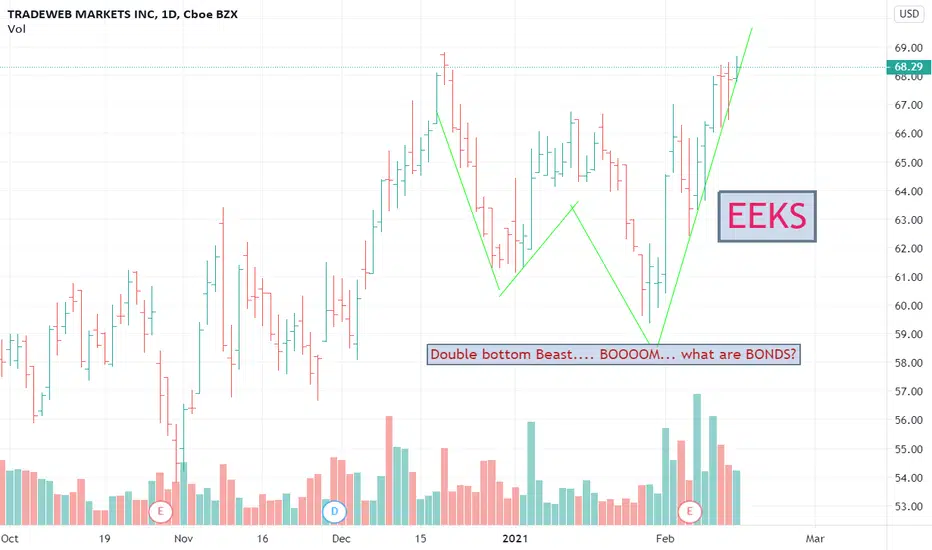
TradeWebMarkets (TW)..Bonds are Back!After what felt like a lifetime of zero-to-near-zero interest rates, the fixed income markets are finally back on the radar screen offering yields that, albeit still not covering current inflation levels, are nonetheless a relatively reasonable return given the risk-reward trade-off vs equities. Sh

$TW with a Bullish outlook following its earnings #Stocks The PEAD projected a Bullish outlook for $TW after a Negative over reaction following its earnings release placing the stock in drift C.

$TW with a Bullish outlook following its earnings #Stocks The PEAD projected a Bullish outlook for $TW after a Negative Under reaction following its earnings release placing the stock in drift D.

12/26/21 TWTradeweb Markets, Inc. ( NASDAQ:TW )
Sector: Technology Services (Internet Software/Services)
Market Capitalization: 23.001B
Current Price: $98.89
Breakout price: $100.00
Buy Zone (Top/Bottom Range): $97.45-$93.35
Price Target: $105.00-$106.70
Estimated Duration to Target: 33-35d
Contract of Inte

$TW = THE WAY Talk about A TEXT BOOK set up... I'm still cautious on Market but you can't deny the Math. Stage 2 base 42 week set up. Numbers beat the street by 180=% Shrugged off Tech Sell off, Probably the strongest ven diagram intersecting sectors. Muted move through pivot straight column of X's... BLAST's of

See all ideas
Summarizing what the indicators are suggesting.
Neutral
SellBuy
Strong sellStrong buy
Strong sellSellNeutralBuyStrong buy
Neutral
SellBuy
Strong sellStrong buy
Strong sellSellNeutralBuyStrong buy
Neutral
SellBuy
Strong sellStrong buy
Strong sellSellNeutralBuyStrong buy
An aggregate view of professional's ratings.
Neutral
SellBuy
Strong sellStrong buy
Strong sellSellNeutralBuyStrong buy
Neutral
SellBuy
Strong sellStrong buy
Strong sellSellNeutralBuyStrong buy
Neutral
SellBuy
Strong sellStrong buy
Strong sellSellNeutralBuyStrong buy
Displays a symbol's price movements over previous years to identify recurring trends.
Frequently Asked Questions
The current price of TW is 137.04 USD — it has decreased by −1.09% in the past 24 hours. Watch Tradeweb Markets Inc. stock price performance more closely on the chart.
Depending on the exchange, the stock ticker may vary. For instance, on NASDAQ exchange Tradeweb Markets Inc. stocks are traded under the ticker TW.
TW stock has fallen by −0.92% compared to the previous week, the month change is a 0.20% rise, over the last year Tradeweb Markets Inc. has showed a 22.51% increase.
We've gathered analysts' opinions on Tradeweb Markets Inc. future price: according to them, TW price has a max estimate of 210.00 USD and a min estimate of 130.00 USD. Watch TW chart and read a more detailed Tradeweb Markets Inc. stock forecast: see what analysts think of Tradeweb Markets Inc. and suggest that you do with its stocks.
TW stock is 2.81% volatile and has beta coefficient of 0.49. Track Tradeweb Markets Inc. stock price on the chart and check out the list of the most volatile stocks — is Tradeweb Markets Inc. there?
Today Tradeweb Markets Inc. has the market capitalization of 29.24 B, it has increased by 1.08% over the last week.
Yes, you can track Tradeweb Markets Inc. financials in yearly and quarterly reports right on TradingView.
Tradeweb Markets Inc. is going to release the next earnings report on Oct 30, 2025. Keep track of upcoming events with our Earnings Calendar.
TW earnings for the last quarter are 0.87 USD per share, whereas the estimation was 0.86 USD resulting in a 1.22% surprise. The estimated earnings for the next quarter are 0.87 USD per share. See more details about Tradeweb Markets Inc. earnings.
Tradeweb Markets Inc. revenue for the last quarter amounts to 512.97 M USD, despite the estimated figure of 514.34 M USD. In the next quarter, revenue is expected to reach 518.44 M USD.
TW net income for the last quarter is 153.66 M USD, while the quarter before that showed 148.25 M USD of net income which accounts for 3.65% change. Track more Tradeweb Markets Inc. financial stats to get the full picture.
Yes, TW dividends are paid quarterly. The last dividend per share was 0.12 USD. As of today, Dividend Yield (TTM)% is 0.32%. Tracking Tradeweb Markets Inc. dividends might help you take more informed decisions.
Tradeweb Markets Inc. dividend yield was 0.31% in 2024, and payout ratio reached 17.16%. The year before the numbers were 0.40% and 21.01% correspondingly. See high-dividend stocks and find more opportunities for your portfolio.
As of Aug 2, 2025, the company has 1.41 K employees. See our rating of the largest employees — is Tradeweb Markets Inc. on this list?
EBITDA measures a company's operating performance, its growth signifies an improvement in the efficiency of a company. Tradeweb Markets Inc. EBITDA is 1.07 B USD, and current EBITDA margin is 54.93%. See more stats in Tradeweb Markets Inc. financial statements.
Like other stocks, TW shares are traded on stock exchanges, e.g. Nasdaq, Nyse, Euronext, and the easiest way to buy them is through an online stock broker. To do this, you need to open an account and follow a broker's procedures, then start trading. You can trade Tradeweb Markets Inc. stock right from TradingView charts — choose your broker and connect to your account.
Investing in stocks requires a comprehensive research: you should carefully study all the available data, e.g. company's financials, related news, and its technical analysis. So Tradeweb Markets Inc. technincal analysis shows the sell today, and its 1 week rating is neutral. Since market conditions are prone to changes, it's worth looking a bit further into the future — according to the 1 month rating Tradeweb Markets Inc. stock shows the buy signal. See more of Tradeweb Markets Inc. technicals for a more comprehensive analysis.
If you're still not sure, try looking for inspiration in our curated watchlists.
If you're still not sure, try looking for inspiration in our curated watchlists.