3 Top Stock Picks That Could Yield 50% Return by Year End 3 of my top stock picks include:
American Airlines - #AAL - AAL
United Airlines - #UAL - UAL
Delta Airlines - #DAL - DAL
I believe these 3 stocks are well supported and could potentially yield a decent return by year end.
Always remember to Trade Safe - Trade Well
Cheers!
UAL trade ideas

UAL - Shorting the failed breakout of the descending wedgePretty straight forward. United has been building this descending wedge and it has plenty of room left to consolidate down. It failed the breakout today with a gap up in the morning. Also a bearish divergence on the RSI.
Shorted after hours at 25.43 for the weekend

fill the gap baby "wink" target 19major resistance creating the range between 18 and 26. we should see an increase from this area around July-August


UNITED AIRLINES Technical AnalysisHold
For a short term investment, wait before selling.
Long Term investment Hold
$UAL $AAL $DAL $LUV Shortterm ShortsThis mild rally.... will it last?
Looking bright to fade. Will trade options on one of these.
LUV - 75% IV, 30% IVP. Sizzle - 50%
UAL - 110% IV, 33% IVP, Sizzle - 45%
DAL - 95% IV, 25% IVP, Sizzle - 50%
AAL - 136%IV, 33% IVP, Sizzle - 45% - Makes sense. Says a story for every every option trader out there. The risk of AAL going down is huge.
First thing - BACK RATIO SPREAD is not an option in the options strategy
Secondly - Tight Credit Spread can give you Great Credits.
Third - An DEEP OTM Iron Condor would give tremondous credit. Worth Leggin in it too.
Fourth - Diagonal with 4-1 Risk to Reward.
Fifth - Calender Risk 1 -2 Risk to Reward.
These seem to be the best option here. I will do the one that makes sense tomorrow, provided the entry triggers.

Descending Triangle Setup on UALAirline fundamentals are horrible for the rest of 2020, with earnings expected to go DEEP negative (we're talking potential bankruptcy level negative).
50MA and 100MA well below 200MA.
Descending triangle pattern offers well defined stop level.
Few ways I'm considering to play this position:
|Chicken Short|
Short 100 shares, buy 25 CALL expiring Sep. 18, 2020
- BP reduced by ~ $1740
- Defined risk, negative theta
- initial delta between -35 to -50 (more initial directional risk)
- can leg out of call or buyback shares to adjust position
|Partially Covered Call|
Buy 40 shares @ 24.00, short 26 CALL expiring Sep. 18, 2020
- BP reduced by ~ $1200
- Undefined risk, delta capped at -60, positive theta
- initial delta between -12 to -20 (less initial directional risk)
- can buy/sell shares and roll call out in time to adjust position
With a stop at 26.50 price level, the total risk should be somewhere between $40 - $300 depending on which strategy is used and when the stop triggers.
TP aimed around 17.10 price level.


UAL' s Bull TRAP ????Hello! Friends,
If NASDAQ:UAL breaks the support line, so the fake breakout will be confirmed. Also you can short it.

Bearish on UALThe chart is displaying a textbook bearish symmetrical triangle. I opened a 05/15 27.5 put for $125 took profit at $600. But I am expecting it to decline towards $15-$13 within the next month or so.
No one is traveling, this company his hemorrhaging money daily and they were just hit with a lawsuit by the Unions (which will be retracted in a few weeks, then the stock will go up).
However, Still Bearish.


nice candle and volume on Friday.Please note: just sharing my view. its not a recommendation for buying or selling

United Airlines Holdings Inc (UAL - US) WXY down United Airlines Holdings Inc (UAL - US) is in WXY pattern. X wave is completed in triangle, but wait for triangle break down or impulse down in smaller time frame for confirmation before trade for Y wave down.

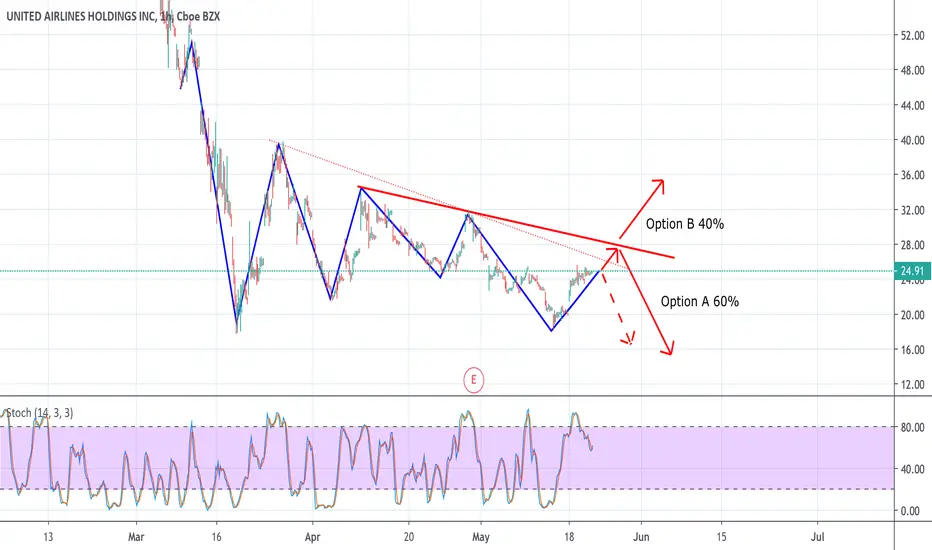
UNITED AIRLINES HOLDINGS INChigh probability next target $21.31
if the price forcefully breaks the white horizontal line, a high probability next target $32.94
if you need an analysis do not hesitate to contact me.
don't forget to subscribe to receive updates if you find interesting what I do

UNITED AIRLINES; Ready for Take Off or Have We Not Even Landed?✨ We provide charts every day ✨
Like and Follow to help us grow family! 🎉
---
Good morning, this is your captain speaking 👨✈️, looks like United Airlines (UAL) may be in for turbulence depending on the reaction at support here. Today we are looking to see if UAL is going to retain its short term uptrend, giving us a smooth landing, or if we are going to be looking at a double bottom or lower.
---
1. Fractal Trend is showing a downtrend (Red background color) for UAL on the hourly chart.
2. Breakaway Scalper is currently neutral (Grey bar color), so we have no trade.
3. With this strategy we enter long ONLY when Fractal Trend shows a Green background and Breakaway Scalper shows a Green bar color. We enter short on opposite conditions (Red on Red) and otherwise want to be in cash.
4. While there is still a question if airlines in general are bottoming or are going to see more downside (many airline charts look like this, as does the airline ETF JETS), for now we are still holding support as illustrated on the chart.
5. If supports holds, we will be looking for reactions at R1 and R2 resistance. After that we have the top of the current price structure at R3 and then otherwise bearish order blocks at R4 - R6 which were formed on the way down.
6. Support levels below include the bullish order blocks at S1 - S3.
7. It is likely the fate of the airlines is tied overall to the market's reaction to the state of COVID and the economy. Do we reopen and start getting back to normal? That is of course bullish for airlines. Do we try to come out of hiding only to see our shadow and then find ourselves with weeks more of lockdown? In that case there could be a chance airlines haven't even landed yet.

$UAL United Airlines breaking out
Its not about the $$$ possibly its about the commentary
Big day ahead for airlines with AAL reporting before the opne.
Gilead is a game changer for the travel industry,

( UAL)ARE YOU STILL SHORTING NICE TRYamazing feel free to contact me in any questions breakout 27 pt short 32 area

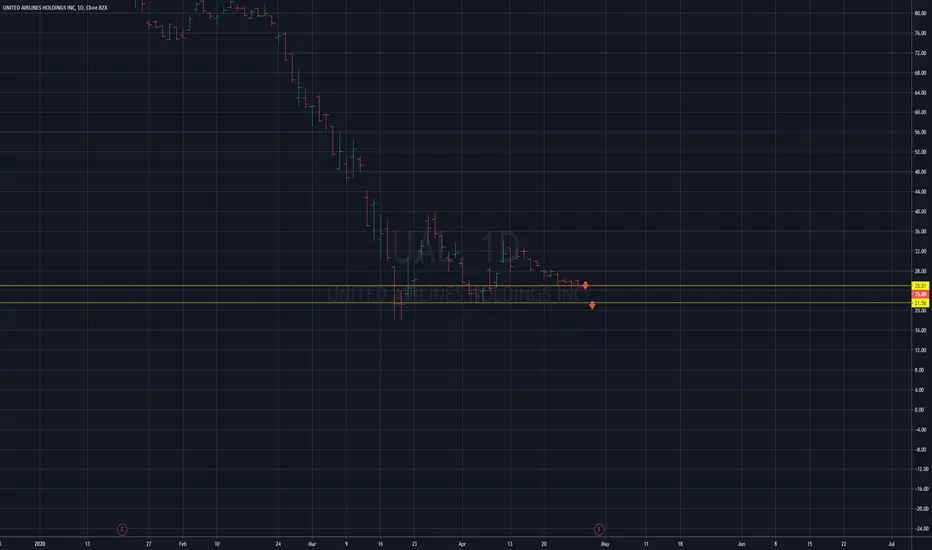
UNITED AIRLINES HOLDINGS INCNASDAQ:UAL
like I said, airlines don't look good.
One more short.
The details are on the chart.

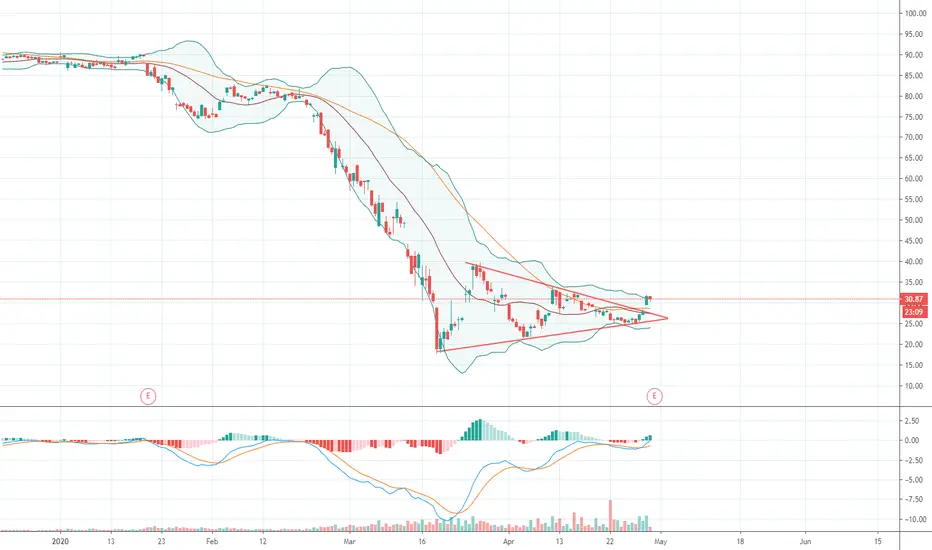
Triangolo in rotturaSi è completato un triangolo simmetrico, che sembra voler essere rotto a ribasso.
Complice il momento macroeconomico negativo dovuto al lockdown, le compagnie aeree avranno difficoltà a riprendersi presto.
Questo potrebbe portare il titolo a scendere fino alle aree indicate grazie a Fibonacci.

Record Breaking Volume Bullish SignalUAL witnessed a record breaking daily volume today while it struggled not to lose this support. At any rate, it feels like the buyers won. But we will see for sure in the upcoming days. If you want to be safe, wait till it breaks up the trigger line. And in the unlikely event of losing this support, you could close your position and wait to see how it treats the last low.

UAL Long, Option trade with big stop bufferExisting Condition:
1. Wedge pattern
2. 3rd touch at the bottom trend line.
Stock Entry: below 26
Stop: 24 (after trendline break)
Target: 50; risk/reward=1:12
Stock trade might be stopped easily.
If it is not an option trade, better wait to short after the bottom trendline break;
or Long after the top trendline break.
In option trade, I bought Sep Call butterfly C35/50/65 (Delta 0.11), limit 1.61;
Sell P13 (Delta -0.12) Limit 1.63;
Total simulate long 23 shares stock for free.
Option stop 13. it is the next fresh weekly demand zone.
If stock price stays between 13 and 35, no gain, no loss;
This is a trading school homework. I need 6 months to practice trading plan.
If you like it, thank you for your support. Please use SIM/Demo account to try it, until my trading plans get high winning rate.
