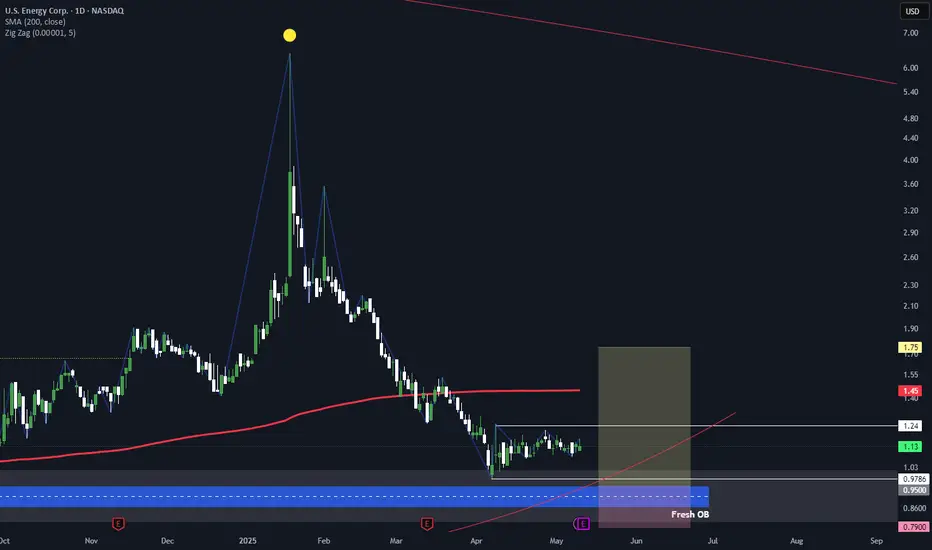
Bullish ideawe need a price action with good volume bouncing up from 0.95 $ to get RR 1:5
the OB is weekly one (has 1 touch) and downgraded to daily (fresh).
your thoughts are so much welcomed by me
Next report date
—
Report period
—
EPS estimate
—
Revenue estimate
—
−0.68 USD
−25.78 M USD
20.62 M USD
12.05 M
About U.S. Energy Corp.
Sector
Industry
Website
Headquarters
Houston
Founded
1966
FIGI
BBG000BW5LG7
US Energy Corp. engages in the acquisition and development of oil and natural gas properties. It operates in Rockis, Mid Con, South Texas, and West Texas. The company was founded on January 26, 1966 and is headquartered in Houston, TX.
Related stocks
The great Texas oil days are over? Been holding this one for a couple years at around 7$ after bottoming out at 1$ a double top at 6$ just occurred on a two year time frame. This could be bullish technically and fundamentally. I will most likely sell half of my shares at 100% profits, it’s then a free car ride.

USEG at last line of support 👀technically speaking it should bounce as long as 1-1.5 holds, but has been stuck between 3-6 since 2019 and not much volume these days.
personally I would look to do a dip buy on other names, but this one can pay.. good luck.. boost and follow for more

$USEG Next Target PTs 13-18 and higherU.S. Energy Corp., an independent energy company, focuses on the acquisition, exploration, and development of oil and natural gas properties in the continental United States. It holds interests in various oil and gas properties in the Williston Basin in North Dakota; the Permian Basin in New Mexico;

$USEG Next Target PT 18 and higherU.S. Energy Corp., an independent energy company, focuses on the acquisition, exploration, and development of oil and natural gas properties in the United States. It holds interests in various oil and gas properties in the Williston Basin in North Dakota, the Permian Basin in New Mexico, the Powder

[USEG] [+40%] Technical and fundamental opportunities// Opening position price - $4.9
// Reasoning:
Changing the channel
Multiple tests of support
Gas and Oil prices in Europe (and in the world) just hit record (fundamental analysis)
// Prediction
I expect

USEG primed for upsideUSEG has again touched off of the bottom side of its long term channel. The BBWP indicates that it is primed for expansion after consolidating and oil prices are on the rise. While this is not financial advice, I believe that USEG will be a strong mover next week into the mid 5 dollar region.

$USEG Support and ResistanceU.S. Energy's new assets to nearly quadruple production
Acquisition News- U.S. Energy Corp. Announces Entry Into Definitive Agreements In Connection With Transformative Acquisitions
U.S. Energy (NASDAQ:USEG) +23.7% pre-market after agreeing to acquire oil and gas assets from Lubbock Energy Partners

Low float energy stock, Possible "Pump & dump"US Energy Corp. engages in the acquisition and development of oil and natural gas properties. Its projects include North Dakota, Texas and Louisiana. The company was founded on January 26, 1966 and is headquartered in Houston, TX

Identifying Pain Points For USEGUSEG is a relatively flat stock for the most part. It's had its share of breakouts here and there but seems to call anything under the 786 fib home. Coincidentally, over the last year, this same 786 fib level has remained a pain point on the chart where USEG might break above it for a moment but fa

See all ideas
Summarizing what the indicators are suggesting.
Neutral
SellBuy
Strong sellStrong buy
Strong sellSellNeutralBuyStrong buy
Neutral
SellBuy
Strong sellStrong buy
Strong sellSellNeutralBuyStrong buy
Neutral
SellBuy
Strong sellStrong buy
Strong sellSellNeutralBuyStrong buy
An aggregate view of professional's ratings.
Neutral
SellBuy
Strong sellStrong buy
Strong sellSellNeutralBuyStrong buy
Neutral
SellBuy
Strong sellStrong buy
Strong sellSellNeutralBuyStrong buy
Neutral
SellBuy
Strong sellStrong buy
Strong sellSellNeutralBuyStrong buy
Displays a symbol's price movements over previous years to identify recurring trends.
Frequently Asked Questions
The current price of USEG is 1.22 USD — it has decreased by −6.06% in the past 24 hours. Watch U.S. Energy Corp. stock price performance more closely on the chart.
Depending on the exchange, the stock ticker may vary. For instance, on NASDAQ exchange U.S. Energy Corp. stocks are traded under the ticker USEG.
USEG stock has fallen by −2.36% compared to the previous week, the month change is a −15.65% fall, over the last year U.S. Energy Corp. has showed a 15.06% increase.
We've gathered analysts' opinions on U.S. Energy Corp. future price: according to them, USEG price has a max estimate of 3.50 USD and a min estimate of 2.00 USD. Watch USEG chart and read a more detailed U.S. Energy Corp. stock forecast: see what analysts think of U.S. Energy Corp. and suggest that you do with its stocks.
USEG reached its all-time high on Oct 5, 1979 with the price of 2,208.65 USD, and its all-time low was 0.81 USD and was reached on Aug 5, 2024. View more price dynamics on USEG chart.
See other stocks reaching their highest and lowest prices.
See other stocks reaching their highest and lowest prices.
USEG stock is 5.72% volatile and has beta coefficient of 1.02. Track U.S. Energy Corp. stock price on the chart and check out the list of the most volatile stocks — is U.S. Energy Corp. there?
Today U.S. Energy Corp. has the market capitalization of 42.15 M, it has decreased by −5.11% over the last week.
Yes, you can track U.S. Energy Corp. financials in yearly and quarterly reports right on TradingView.
U.S. Energy Corp. is going to release the next earnings report on Aug 7, 2025. Keep track of upcoming events with our Earnings Calendar.
USEG earnings for the last quarter are −0.10 USD per share, whereas the estimation was −0.03 USD resulting in a −233.33% surprise. The estimated earnings for the next quarter are −0.06 USD per share. See more details about U.S. Energy Corp. earnings.
U.S. Energy Corp. revenue for the last quarter amounts to 2.19 M USD, despite the estimated figure of 2.99 M USD. In the next quarter, revenue is expected to reach 2.64 M USD.
USEG net income for the last quarter is −3.11 M USD, while the quarter before that showed −12.03 M USD of net income which accounts for 74.13% change. Track more U.S. Energy Corp. financial stats to get the full picture.
As of Jul 31, 2025, the company has 21 employees. See our rating of the largest employees — is U.S. Energy Corp. on this list?
EBITDA measures a company's operating performance, its growth signifies an improvement in the efficiency of a company. U.S. Energy Corp. EBITDA is −1.66 M USD, and current EBITDA margin is −0.26%. See more stats in U.S. Energy Corp. financial statements.
Like other stocks, USEG shares are traded on stock exchanges, e.g. Nasdaq, Nyse, Euronext, and the easiest way to buy them is through an online stock broker. To do this, you need to open an account and follow a broker's procedures, then start trading. You can trade U.S. Energy Corp. stock right from TradingView charts — choose your broker and connect to your account.
Investing in stocks requires a comprehensive research: you should carefully study all the available data, e.g. company's financials, related news, and its technical analysis. So U.S. Energy Corp. technincal analysis shows the sell today, and its 1 week rating is sell. Since market conditions are prone to changes, it's worth looking a bit further into the future — according to the 1 month rating U.S. Energy Corp. stock shows the sell signal. See more of U.S. Energy Corp. technicals for a more comprehensive analysis.
If you're still not sure, try looking for inspiration in our curated watchlists.
If you're still not sure, try looking for inspiration in our curated watchlists.