Key stats
About ETRACS Crude Oil Shares Covered Call ETNs due April 24, 2037
Home page
Inception date
Apr 25, 2017
Structure
Exchange-Traded Note
Dividend treatment
Distributes
Distribution tax treatment
Ordinary income
Income tax type
Capital Gains
Max ST capital gains rate
39.60%
Max LT capital gains rate
20.00%
Distributor
Credit Suisse Securities (USA) LLC
USOI adds a twist to the crude oil segment by extracting income from oil futures exposure. The ETN provides the return of USCF`s popular front-month oil ETF, USO, coupled with a notional short position in USO calls expiring the next month with strike prices 6% out of the money. The strategy adds yield and lowers volatility compared to owning USO outright, but at the cost of upside participation. Therefore, USOI is likely to perform very differently from crude oil futures. USOI aims to distribute yield monthly, typical of an ETN. Prior to May 31, 2024 the Issuer and counterparty credit risk of this ETN was Credit Suisse AG.
Classification
No news here
Looks like there's nothing to report right now


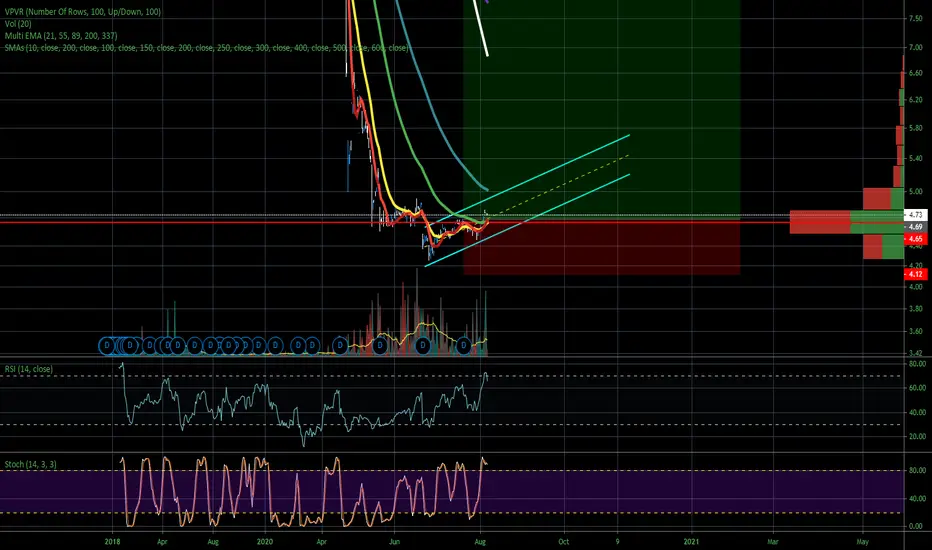
Can anyone see this playing out? Lot of catalysts in the market driving a temporary reversal in renewable energy markets, perhaps in the direction of safer undervalued markets. This trade has a narrative behind it, and potential technical price points to aim for in the next 2-4 years that could shape up to be a fantastic comeback f

See all ideas
Summarizing what the indicators are suggesting.
Oscillators
Neutral
SellBuy
Strong sellStrong buy
Strong sellSellNeutralBuyStrong buy
Oscillators
Neutral
SellBuy
Strong sellStrong buy
Strong sellSellNeutralBuyStrong buy
Summary
Neutral
SellBuy
Strong sellStrong buy
Strong sellSellNeutralBuyStrong buy
Summary
Neutral
SellBuy
Strong sellStrong buy
Strong sellSellNeutralBuyStrong buy
Summary
Neutral
SellBuy
Strong sellStrong buy
Strong sellSellNeutralBuyStrong buy
Moving Averages
Neutral
SellBuy
Strong sellStrong buy
Strong sellSellNeutralBuyStrong buy
Moving Averages
Neutral
SellBuy
Strong sellStrong buy
Strong sellSellNeutralBuyStrong buy
Displays a symbol's price movements over previous years to identify recurring trends.
Frequently Asked Questions
An exchange-traded fund (ETF) is a collection of assets (stocks, bonds, commodities, etc.) that track an underlying index and can be bought on an exchange like individual stocks.
USOI trades at 51.23 USD today, its price has fallen −1.01% in the past 24 hours. Track more dynamics on USOI price chart.
USOI net asset value is 51.53 today — it's fallen 7.21% over the past month. NAV represents the total value of the fund's assets less liabilities and serves as a gauge of the fund's performance.
USOI assets under management is 290.66 M USD. AUM is an important metric as it reflects the fund's size and can serve as a gauge of how successful the fund is in attracting investors, which, in its turn, can influence decision-making.
USOI price has fallen by −8.03% over the last month, and its yearly performance shows a −26.19% decrease. See more dynamics on USOI price chart.
NAV returns, another gauge of an ETF dynamics, have fallen by −7.21% over the last month, showed a 0.04% increase in three-month performance and has decreased by −7.91% in a year.
NAV returns, another gauge of an ETF dynamics, have fallen by −7.21% over the last month, showed a 0.04% increase in three-month performance and has decreased by −7.91% in a year.
USOI fund flows account for 14.93 M USD (1 year). Many traders use this metric to get insight into investors' sentiment and evaluate whether it's time to buy or sell the fund.
Since ETFs work like an individual stock, they can be bought and sold on exchanges (e.g. NASDAQ, NYSE, EURONEXT). As it happens with stocks, you need to select a brokerage to access trading. Explore our list of available brokers to find the one to help execute your strategies. Don't forget to do your research before getting to trading. Explore ETFs metrics in our ETF screener to find a reliable opportunity.
USOI expense ratio is 0.85%. It's an important metric for helping traders understand the fund's operating costs relative to assets and how expensive it would be to hold the fund.
No, USOI isn't leveraged, meaning it doesn't use borrowings or financial derivatives to magnify the performance of the underlying assets or index it follows.
In some ways, ETFs are safe investments, but in a broader sense, they're not safer than any other asset, so it's crucial to analyze a fund before investing. But if your research gives a vague answer, you can always refer to technical analysis.
Today, USOI technical analysis shows the sell rating and its 1-week rating is strong sell. Since market conditions are prone to changes, it's worth looking a bit further into the future — according to the 1-month rating USOI shows the sell signal. See more of USOI technicals for a more comprehensive analysis.
Today, USOI technical analysis shows the sell rating and its 1-week rating is strong sell. Since market conditions are prone to changes, it's worth looking a bit further into the future — according to the 1-month rating USOI shows the sell signal. See more of USOI technicals for a more comprehensive analysis.
Yes, USOI pays dividends to its holders with the dividend yield of 28.17%.
USOI trades at a premium (0.58%).
Premium/discount to NAV expresses the difference between the ETF’s price and its NAV value. A positive percentage indicates a premium, meaning the ETF trades at a higher price than the calculated NAV. Conversely, a negative percentage indicates a discount, suggesting the ETF trades at a lower price than NAV.
Premium/discount to NAV expresses the difference between the ETF’s price and its NAV value. A positive percentage indicates a premium, meaning the ETF trades at a higher price than the calculated NAV. Conversely, a negative percentage indicates a discount, suggesting the ETF trades at a lower price than NAV.
USOI shares are issued by UBS Group AG
USOI follows the Credit Suisse NASDAQ WTI Crude Oil FLOWS 106 Index. ETFs usually track some benchmark seeking to replicate its performance and guide asset selection and objectives.
The fund started trading on Apr 25, 2017.
The fund's management style is passive, meaning it's aiming to replicate the performance of the underlying index by holding assets in the same proportions as the index. The goal is to match the index's returns.