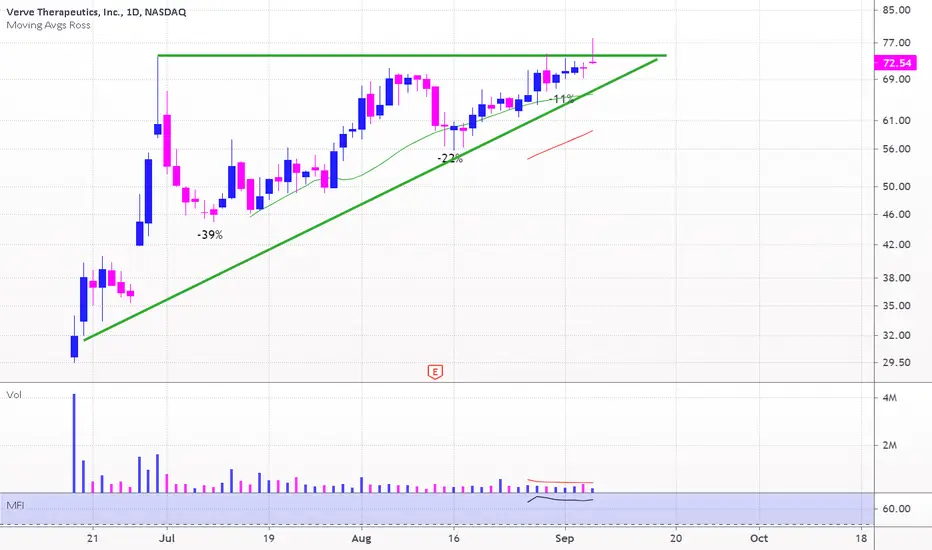
The Next Big Healthcare Stock?The chart for VERV shows a prolonged downtrend since mid-2021, with multiple resistance trendlines capping price action. However, the stock is now testing a potential breakout above these trendlines and the 50-week EMA (green line), which has acted as dynamic resistance. The RSI is rising above 60,
Next report date
—
Report period
—
EPS estimate
—
Revenue estimate
—
−2.11 USD
−198.71 M USD
32.33 M USD
65.76 M
About Verve Therapeutics, Inc.
Sector
Industry
CEO
Sekar Kathiresan
Website
Headquarters
Boston
Founded
2018
FIGI
BBG00P33TCZ8
Verve Therapeutics, Inc. is a genetic medicines company, which engages in the development of approach to the care of cardiovascular diseases. The company was founded by Burt A. Adelman, Keith J. Joung, Sekar Kathiresan, Kiran Musunuru, Anthony Philippakis, Issi Rozen, and Barry Ticho in 2018 and is headquartered in Boston, MA.
Related stocks

VERV Long Trade Setup !📈 Breakout Potential: VERV is forming a bullish continuation pattern, indicating upward momentum.
📊 Key Levels:
Entry: $7.81 ✅
Stop Loss (SL): $7.12 🛡️
Target 1 (T1): $8.46 🎯
Target 2 (T2): $9.30 🚀
🔍 Volume Confirmation: Watch for an increase in buying pressure to confirm the breakout.
💡 Opportunity

H5_L Screener Run Through! 22Jan2025In this video, I run through my H5_L Screener!
Todays date: 22Jan2025
Found some great trades and setups using my screener!
Not financial advice

VERV forming base with news on clinical trial in Q2-2025.Speculative play with base formation since July 2024. . Making higher lows since Oct 2024 ($4.37).

Pay attention to VERVdon't want to give a forecast now because the stock is still in a somewhat problematic area,
but you can take a look at the attached picture
Nice volume today
to follow...
Not a recommendation of course...
The only way to trade the stock market... continued in my signature below
NASDAQ:VERV

IPO Breakout in VERVLike many other recent IPOs, Verve Therapeutics set up in a nice technical base and is now beginning to break out. A series of lower lows shows that volume is drying up as pullbacks became shallower - a sign the stock is moving from weak hands to strong hands.
$VERV is giving a GREAT IPO LONG opportunity todayIPO intraday trading strategy idea
Verve Therapeutics is genetic medicines company pioneering a new approach to the care of cardiovascular disease, or CVD, transforming treatment from chronic management to single-course gene editing medicines.
The share price is rising and gonna continue this tren

See all ideas
Summarizing what the indicators are suggesting.
Neutral
SellBuy
Strong sellStrong buy
Strong sellSellNeutralBuyStrong buy
Neutral
SellBuy
Strong sellStrong buy
Strong sellSellNeutralBuyStrong buy
Neutral
SellBuy
Strong sellStrong buy
Strong sellSellNeutralBuyStrong buy
An aggregate view of professional's ratings.
Neutral
SellBuy
Strong sellStrong buy
Strong sellSellNeutralBuyStrong buy
Neutral
SellBuy
Strong sellStrong buy
Strong sellSellNeutralBuyStrong buy
Neutral
SellBuy
Strong sellStrong buy
Strong sellSellNeutralBuyStrong buy
Displays a symbol's price movements over previous years to identify recurring trends.
Frequently Asked Questions
The current price of VERV is 11.06 USD — it has decreased by −0.27% in the past 24 hours. Watch Verve Therapeutics, Inc. stock price performance more closely on the chart.
Depending on the exchange, the stock ticker may vary. For instance, on NASDAQ exchange Verve Therapeutics, Inc. stocks are traded under the ticker VERV.
VERV stock has fallen by −1.51% compared to the previous week, the month change is a 78.39% rise, over the last year Verve Therapeutics, Inc. has showed a 75.48% increase.
We've gathered analysts' opinions on Verve Therapeutics, Inc. future price: according to them, VERV price has a max estimate of 15.00 USD and a min estimate of 11.00 USD. Watch VERV chart and read a more detailed Verve Therapeutics, Inc. stock forecast: see what analysts think of Verve Therapeutics, Inc. and suggest that you do with its stocks.
VERV reached its all-time high on Sep 7, 2021 with the price of 78.00 USD, and its all-time low was 2.86 USD and was reached on Apr 9, 2025. View more price dynamics on VERV chart.
See other stocks reaching their highest and lowest prices.
See other stocks reaching their highest and lowest prices.
VERV stock is 0.64% volatile and has beta coefficient of 2.08. Track Verve Therapeutics, Inc. stock price on the chart and check out the list of the most volatile stocks — is Verve Therapeutics, Inc. there?
Today Verve Therapeutics, Inc. has the market capitalization of 985.92 M, it has decreased by −0.71% over the last week.
Yes, you can track Verve Therapeutics, Inc. financials in yearly and quarterly reports right on TradingView.
Verve Therapeutics, Inc. is going to release the next earnings report on Aug 7, 2025. Keep track of upcoming events with our Earnings Calendar.
VERV earnings for the last quarter are −0.35 USD per share, whereas the estimation was −0.64 USD resulting in a 45.65% surprise. The estimated earnings for the next quarter are −0.69 USD per share. See more details about Verve Therapeutics, Inc. earnings.
Verve Therapeutics, Inc. revenue for the last quarter amounts to 32.98 M USD, despite the estimated figure of 9.01 M USD. In the next quarter, revenue is expected to reach 4.52 M USD.
VERV net income for the last quarter is −31.03 M USD, while the quarter before that showed −50.03 M USD of net income which accounts for 37.98% change. Track more Verve Therapeutics, Inc. financial stats to get the full picture.
No, VERV doesn't pay any dividends to its shareholders. But don't worry, we've prepared a list of high-dividend stocks for you.
As of Jul 11, 2025, the company has 274 employees. See our rating of the largest employees — is Verve Therapeutics, Inc. on this list?
EBITDA measures a company's operating performance, its growth signifies an improvement in the efficiency of a company. Verve Therapeutics, Inc. EBITDA is −201.62 M USD, and current EBITDA margin is −686.34%. See more stats in Verve Therapeutics, Inc. financial statements.
Like other stocks, VERV shares are traded on stock exchanges, e.g. Nasdaq, Nyse, Euronext, and the easiest way to buy them is through an online stock broker. To do this, you need to open an account and follow a broker's procedures, then start trading. You can trade Verve Therapeutics, Inc. stock right from TradingView charts — choose your broker and connect to your account.
Investing in stocks requires a comprehensive research: you should carefully study all the available data, e.g. company's financials, related news, and its technical analysis. So Verve Therapeutics, Inc. technincal analysis shows the buy rating today, and its 1 week rating is buy. Since market conditions are prone to changes, it's worth looking a bit further into the future — according to the 1 month rating Verve Therapeutics, Inc. stock shows the buy signal. See more of Verve Therapeutics, Inc. technicals for a more comprehensive analysis.
If you're still not sure, try looking for inspiration in our curated watchlists.
If you're still not sure, try looking for inspiration in our curated watchlists.