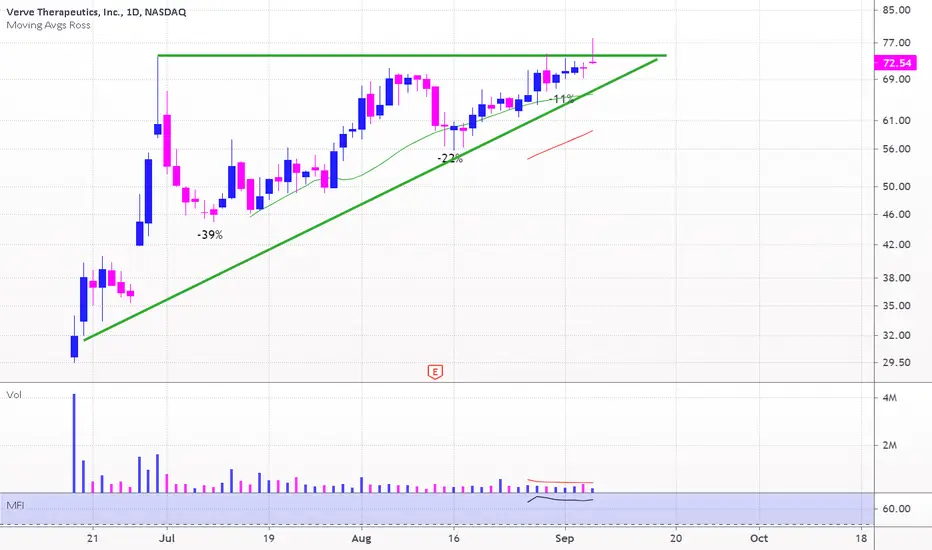
The Next Big Healthcare Stock?The chart for VERV shows a prolonged downtrend since mid-2021, with multiple resistance trendlines capping price action. However, the stock is now testing a potential breakout above these trendlines and the 50-week EMA (green line), which has acted as dynamic resistance. The RSI is rising above 60, signaling increasing bullish momentum, and the latest weekly candle, up 11.28%, suggests growing buying interest. If VERV successfully holds above this breakout zone, it could push toward the $10-$15 resistance range, confirming a trend shift. However, failure to sustain above the 50EMA could result in another rejection, reinforcing the downtrend. Volume is picking up, adding weight to the bullish case, but confirmation above key levels remains crucial for a sustained move higher.
Disclaimer:
This analysis is for educational purposes only and should not be considered financial advice. Trading and investing involve risk, and independent research or consultation with a professional is recommended before making any financial decisions.
VERV trade ideas

VERV Long Trade Setup !📈 Breakout Potential: VERV is forming a bullish continuation pattern, indicating upward momentum.
📊 Key Levels:
Entry: $7.81 ✅
Stop Loss (SL): $7.12 🛡️
Target 1 (T1): $8.46 🎯
Target 2 (T2): $9.30 🚀
🔍 Volume Confirmation: Watch for an increase in buying pressure to confirm the breakout.
💡 Opportunity: A strong setup with favorable risk-reward to capture the next move higher. 💥
#VERV #StockTrading #TradingView #LongTrade #BullishSetup #StockMarket #TechnicalAnalysis #ChartPatterns #MomentumTrading #SwingTrading #RiskManagement #ProfitableTrading #BreakoutAnalysis

H5_L Screener Run Through! 22Jan2025In this video, I run through my H5_L Screener!
Todays date: 22Jan2025
Found some great trades and setups using my screener!
Not financial advice

VERV forming base with news on clinical trial in Q2-2025.Speculative play with base formation since July 2024. . Making higher lows since Oct 2024 ($4.37).

Pay attention to VERVdon't want to give a forecast now because the stock is still in a somewhat problematic area,
but you can take a look at the attached picture
Nice volume today
to follow...
Not a recommendation of course...
The only way to trade the stock market... continued in my signature below
NASDAQ:VERV

IPO Breakout in VERVLike many other recent IPOs, Verve Therapeutics set up in a nice technical base and is now beginning to break out. A series of lower lows shows that volume is drying up as pullbacks became shallower - a sign the stock is moving from weak hands to strong hands.
$VERV is giving a GREAT IPO LONG opportunity todayIPO intraday trading strategy idea
Verve Therapeutics is genetic medicines company pioneering a new approach to the care of cardiovascular disease, or CVD, transforming treatment from chronic management to single-course gene editing medicines.
The share price is rising and gonna continue this trend today.
The demand for shares of the company still looks higher than the supply.
These and other conditions can cause a rise in the share price today.
So I opened a long position from $31.50;
stop-loss — $27.14;
take-profit — $44.58/MOC price.
Do not view this idea as a recommendation for trading or investing. It is published only to introduce my own vision.
Always do your own analysis before making deals. When you use any materials, do not rely on blind trust.
You should remember that isolated deals do not give systematic profit, so trade/invest using a developed strategy.
If you like my content, you can subscribe to the news and receive my fresh ideas.
