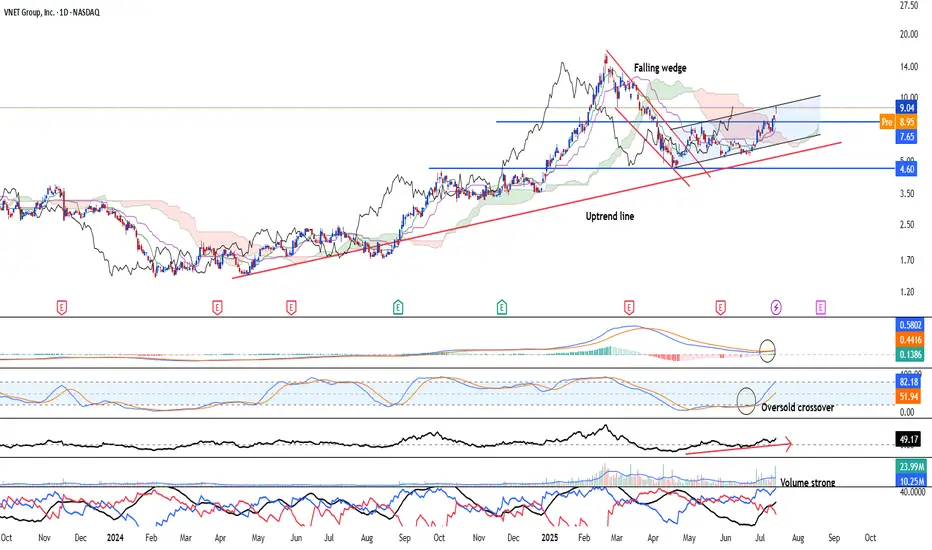
Vnet Group - Bullish trend in an early stage NASDAQ:VNET is looking at an early bullish trend continuation after the stock has broken out of the falling wedge and forms a pair of higher high and higher low. Uptrend remain intact since April 2024. Stock is likely to see strong upside going forward.
Long-term MACD just see a crossover. and histogram is positive. Stochastic oscillator has risen after confirming the oversold crossover and 23-period ROC is positive.
Volume is strong along with the uptrend and directional movement index is strongly bullish.
We see the target able to reach US$20.00. support will be at 7.65 and 6.27
VNET trade ideas
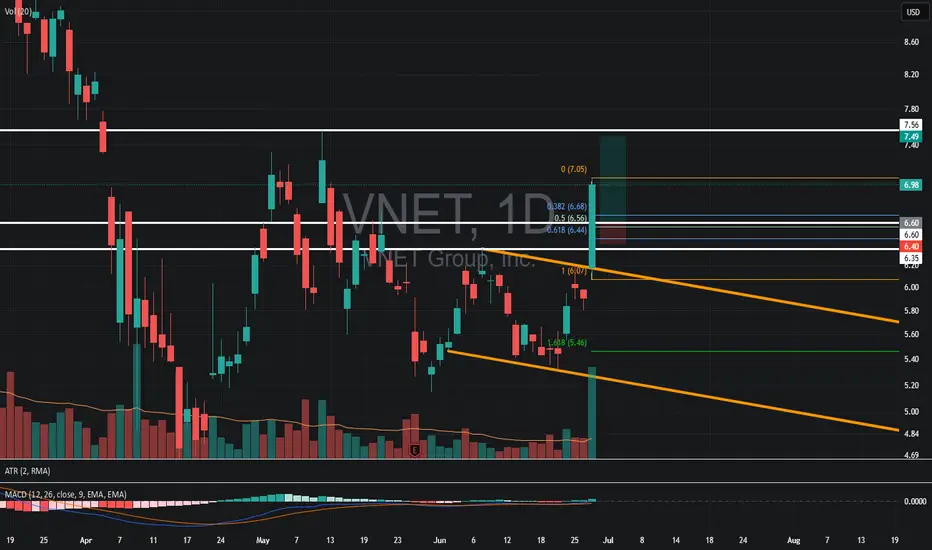
VNET – Watching for a Pullback Buy OpportunityWhy It's on My Radar:
Just broke out of a downward channel with solid volume
MACD curling up — bullish crossover setting up
Not trying to catch a falling knife here — waiting patiently for a clean pullback.
Key Level I’m Watching:
~$6.60 → lines up closely with the 0.50 fib retracement and prior resistance — could flip to support
If price bases there with decent volume, I’ll consider a long.
VNET V Curve or Early Smile Face?Very Risky, only for the Brave ones.
Do not enter this one unless you have spare Capital to possibly lose.
This is only a Plot. Whilst these studies do work around 66% of the time, there is always the possibility of a reversal.
If your Risk is low, rather stay away.
Timing is also important, and setting ones Stop loss will always ensure that when in profit, you do win.
As always if you are unsure please consult with your own personal investment Advisor before making any Trades or Investments as most are 12 months or more views.
Markets are Choppy and can move in both up and down.
Should you appreciate my comments and chart studies - please smash that like button. It's just a click away.
Regards Graham

VNET Up +- 40% From Potential Double Bottom. The Big Picture.VNET is Up +- 40% From the Potential Double Bottom.
Remains Extremely Risky and Speculative.
However, ones best returns are often seen from these Risks.
This is also a China Trade, and not a Long Term Investment.
However, the prior Levels do show GREAT Potential for further Upside.
I started to nibble on the Bottoms with only a few $100 and is working for now.
Follow the Larger Trend. Use 2 to 3 time frames to see the 30M, 4H and 1W Trend. Make your decision's based on the Larger 1W Trend.
This is a Speculative 6 - 12 Month Trade.
I also use the IMACD indicator to see the rate of change, also the CCI Stochastic.
As always, please get a few outside Expert's Advice before taking Trade or Investment Decisions.
Should you appreciate my Chart Studies, Smash That Rocket Boost Button. It's Just a Click away.
Regards Graham.

VNET china name that can pay niceNASDAQ:VNET got hammered due to the regulation talk. Reversing here and can rip over $24

+37% profit on VNET , Did you get some?It takes a lot to make money in the stock market More than nice charts .
This thing has potential to go higher and it could go lower too , so play it safe always .
#Stay_safe .
Trader K


VNET, price exceeded its 50-day Moving Average on Oct 08, 2020This price move could indicate a change in the trend, and may be a sell signal for investors. Tickeron A.I.dvisor found 46 similar cases, and 42 were successful. Based on this data, the odds of success are 90%. Current price $23.07 crossed the support line at $22.76 and is trading between $23.52 support and $22.76 support lines. Throughout the month of 09/08/20 - 10/08/20, the price experienced a +7% Uptrend, while the week of 10/01/20 - 10/08/20 shows a -5% Downtrend.
Bearish Trend Analysis
The Stochastic Indicator may be shifting from an upward trend to a downward trend. Tickeron A.I. detected that in 46 of 54 cases where VNET's Stochastic Oscillator exited the overbought zone, the price fell further within the following month. The odds of a continued downward trend are 85%.
The 10-day Moving Average for VNET crossed bearishly below the 50-day moving average on August 24, 2020. This indicates that the trend has shifted lower and could be considered a sell signal. Tickeron A.I. detected that in 13 of 19 past instances when the 10-day crossed below the 50-day, the stock continued to move higher over the following month. The odds of a continued downward trend are 68%.
Following a 3-day decline, the stock is projected to fall further. Considering past instances where Apple declined for three days, the price rose further in 50 of 62 cases within the following month. The odds of a continued downward trend are 79%.
VNET broke above its upper Bollinger Band on September 29, 2020. This could be a sign that the stock is set to drop as the stock moves back below the upper band and toward the middle band. You may want to consider selling the stock or exploring put options.
The Aroon Indicator for VNET entered a downward trend on September 03, 2020. This could indicate a strong downward move is ahead for the stock. Traders may want to consider selling the stock or buying put options.

$VNET can rise in the next daysContextual immersion trading strategy idea.
21Vianet Group, Inc. provides carrier and cloud-neutral Internet data center services to Internet companies, government entities, blue-chip enterprises, and small-to mid-sized enterprises in the People's Republic of China.
The demand for shares of the company still looks higher than the supply.
This and other conditions can cause a rise in the share price in the next days.
So I opened a long position from $24,14;
stop-loss — $23,24.
Information about take-profits will be later.
Do not view this idea as a recommendation for trading or investing. It is published only to introduce my own vision.
Always do your own analysis before making deals. When you use any materials, do not rely on blind trust.
You should remember that isolated deals do not give systematic profit, so trade/invest using a developed strategy.
If you like my content, you can subscribe to the news and receive my fresh ideas.
Thanks for being with me!


21Vianet Announces US$20 Million Share Repurchase ProgramVNET: 21Vianet Group, Inc.
2019-12-04 06:30:10
21Vianet Announces US$20 Million Share Repurchase Program


VNET Breakout LongAn idea for a long trade on VNET, Showing signs of consolidation and possible uptrend on the 3 Month chart. Wait for a break above the consolidation resistance line, confirmation of uptrend leads to an entry on the second low, placing stop loss at the last low or below the support created by old resistance. Follow uptrend with a trailing stop loss to maximize profits. Refer possibly to MACD & RSI to bolster confidence upon entry if it doesn't show signs of being overbought.


VNET breakoutLooking at chart of VNET today. Looks like a breakout:
1) MACD fast line crosses over slow line.
2) MACD crossover occurs above 0.
3) New 52-week high
4) Increased volume on breakout.
I took a long position on VNET today. (Just a smallish position).
In at $10.60 (just above the high on July 3, and above the previous day's high). My stop-loss is slightly below 13-day EMA (currently at $9.95) so I set my stop loss at $9.75. My target here is unknown. A 10% gain would put it at $11.66, 20% gain at $12.72. I will have a trailing stop-loss on this one to slightly below 13-day EMA.
Good luck out there!

VNET to break out and fill red candleVnet has been bullish under the radar looking to fill a red candle a few months ago.
Bullish VNETlooks like this one is getting ready to rum. i think it may go to 10. IMHO.
Do your own DD.

VNET - Long from current position VNET is forming a fallen-Angel pattern. Got some upward strength as it crossed EMA lines & money-flow turned positive.
We think it can go up to 15.15 or as high as 18.40 in long term.

VNET ready to PopAbove average volume pouring into VNET. Institutional support looks good for a breakout around $21.21

