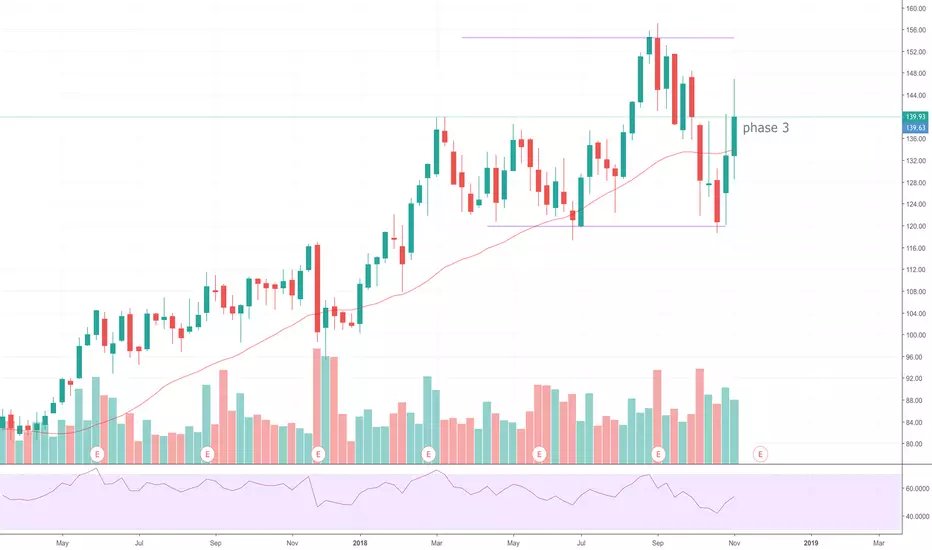
[WDAY] phase 3The price is going up. It's above the 30MM. Speak of 30MM; its slope is positive so, maybe it will continue to phase 2.
WDAY trade ideas
WDAY looks like it wants to make a move, but which way?WDAY seems ready to move a move to either side although down seems more likely since it had a big move up in the recent months. Short looks good below $136, or if the level holds long on the break of short term Trend line.
DISCLAIMER: This is not a financial advice, so please do your due diligence.
Also for more in-depth analysis of our trade ideas please check out our YOUTUBE channel @PMT Trading.

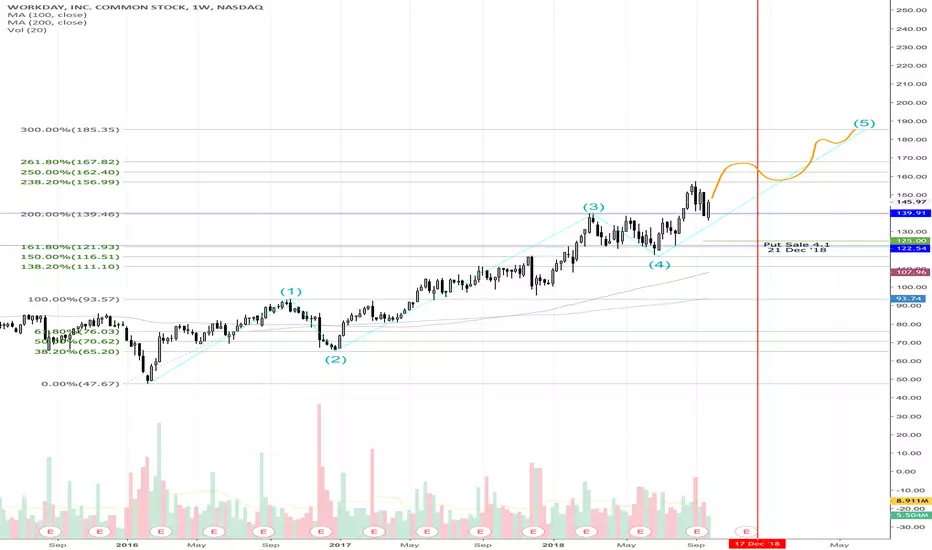
WDAY Fib and S Curveangles for wave 1,2 and 5 are all the same and 5 ends at the 300% Fib line. WHere I sold a Put was a good place to buy based on this analyis, will watch it for a more long term entry.
Solid Trend
$WDAY Overbought at Channel Resistance$WDAY Workday deep into overbought territory now on the daily chart, with an earnings release coming early next week.
For a company still not making any money, it feels like a beat is already priced in. In my opinion, it would require a substantial beat and a positive guidance adjustment next week to get it over $155 in the near term. I'm expecting a correction post-earnings.
Two possible near/medium term targets on chart.
Note: Informational analysis, not investment advice.

$WDAY - Top CalllaaaaaaBeen had this one on watch because the setup is always a reliable one that uses the white curve (55 low MA) as a top caller based on the curve of the lows where 55 low uses 180 WMA as resistance - price drops as the white curve slopes to the most upward point without crossing over the blue 180. I tend to use the red vertical line just as a reference point to where the white curve either A) start of the 55 candle count makes higher lows (hence, white MA slopes upward) or B) start of the 55 candle count makes a few higher lows (white MA slopes upward) but is short lived, & continues making new lows (hence, white curve slopes upward temporarily, but the new lows add to the resistance point not being crossed). This is typically a setup I see with upcoming earnings - but $WDAY doesn't have earnings until Sept. 4th - so I'm kinda going out on a limb with this one, because it's usually a home run short entry regardless of earnings beat/miss. Regardless, as long as I don't see the cross of 55 low MA above the 180 WMA - ideal target price is @ or around $126-$130. I'll leave a few examples
Ex. 1 -
Ex. 2 -

WDAY up against resistanceTwo resistance levels ahead for WDAY to cross. If it can break out, off we go. We'll find out in next couple of days.

WDAY looks interestingRiding that line, earnings coming out tomorrow; which way do you think it'll go?
Long June 15 calls so I'm praying it pops!

POSTED the correct MINOR CYCLES ON WDAYSucks it cost me 2k on the put spread I had bought
My minor cycles were totally off
The correct minor cycles exactly were predicting the move today and show it exactly as it happens now.
Big move to come though at mi/late June
We might get a higher high at this point due to previous all time high
but then retrace back to 23-28% fib and then rally again...

Workday got away from me this morningNice move to the upside and crossing over the MAs.
I was just about to add some to my position, but this one got away as I was driving. This is a great lesson for myself to focus on taking the opportunity when i see it.

WDAY looks corrective at 110 by end of May/early JuneBased on my analysis ,
I notice that WDAY has right now entered a corrective phase which could potentially take it to the area of 109-111 by the end of May , beginning of June.
I post here only the weekly cycles , but the daily cycles also show a correction and negative momentum as well .
All the rallies should be sold on the stock in my opinion .


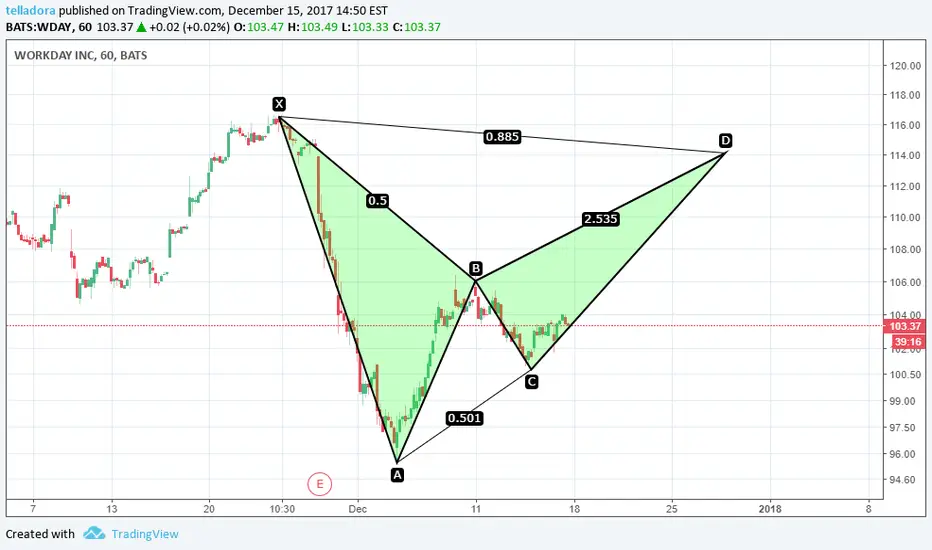
Possible Bearish Bat
Something to keep our eye on.
End game is 113 by January 12th, if this holds true, then I will do a short profit target analysis

WDAY Bat formation (almost perfect Bat) lets see 115 by JanWDAY Bat formation (almost perfect Bat) lets see 115 by year end


WDAY in consolidation If WDAY can reclaim the 104 level then it could be a good dip buy otherwise wait for consolidation to end.
