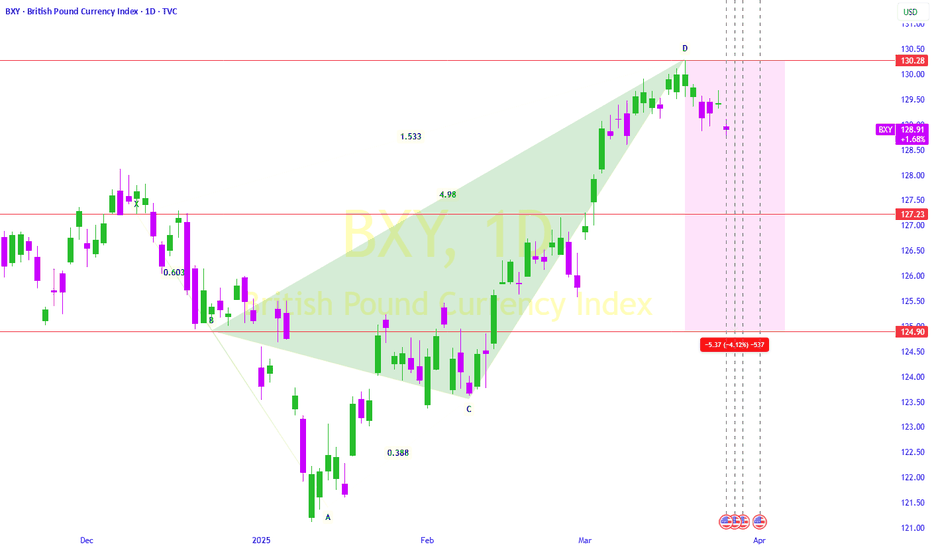
BXY Against Resistance ZoneHi,
BXY on the 1-hour chart remains bullish, supported by the 133.96 low, which is attributed to the bullish pin from Thursday, May 22, 2025. This is a thin area, consolidating bullishly against the 134.30 level, driven more by price volatility than by price momentum.
There is strong bullish press
Related indices
BXY Trade Plan (BXY 18/05)TVC:BXY
Price is in long term bull trend but with medium term flag pattern forming which is confirmed by the head and shoulder pattern we have recently seen.
I would like to see price move a little lower into Fib level range and then push higher so the plan here is to wait before heading north.
BXY Bullish OptimismHello there,
BXY has moved above the RSI 25 and crossed the RSI moving average (MA), indicating an attempt by the bulls to push the market higher from the oversold region.
If the price holds above the RSI MA, there is a greater likelihood of moving higher. The desired price target is 129.10.
More
Trend of British Pound Currency Indexthe detail is shown in the above Idea.
I made this Idea based on Candlestick Analysis and Harmonic pattern.
bear market turning into bull Market with GBP Crab.
Bullish crab pattern
It begins at point X and extends to point A. Point X may be anywhere on the price chart, but looking for a bull
British Pound Currency Index, heading where next?British pound currently is having a strong headwind to reduce the pound strengthen coming to the market in play. It just started and the strong headwind is the potential pause of the BOE rate hike coming in 2024 as the inflation CPI of 11% previously in 2022 by the UK CPI is currently only at 4.60%.
"Analyzing BXY's Descending Triangle: Waiting for a Breakout DirDescending Triangle Pattern: You've identified a descending triangle pattern on BXY's chart. This pattern typically consists of a horizontal support line and a series of lower highs, forming a triangle shape. It's considered a bearish pattern and often leads to a breakout in a downward direction.
D
BXY Analysis 10/10/2023As you can see with the current state of the BXY market, it is currently in and upwards trend creating higher lows consistently marked by the circles on the closes of the wicks. The red rectangle marks out the area where price was operating below my entry price on GBP/USD and as you can see the arro
See all ideas
Displays a symbol's price movements over previous years to identify recurring trends.
Frequently Asked Questions
PHLX British Pound reached its highest quote on Nov 8, 2007 — 211.17 USD. See more data on the PHLX British Pound chart.
The lowest ever quote of PHLX British Pound is 102.00 USD. It was reached on Sep 30, 2022. See more data on the PHLX British Pound chart.
PHLX British Pound is just a number that lets you track performance of the instruments comprising the index, so you can't invest in it directly. But you can buy PHLX British Pound futures or funds or invest in its components.


