EXYEuro Index Price. Wait for very small up after that market will drop. For those who interested in EXY
XDE trade ideas

(EXY) Euro Currency Index to 99,60 Euro Currency Index to 99,60
making a double bottom then up
the DXY is currently making a double bottom
let me know what you think

EURUSD POTENTIEL LONG OPPORTUNITYDXY AND EXY FORMING H&S PATTERN , DXY DOWN - EXY UP! WE MIGHT SEE THE EURUSD STRENGTH VERY SOON.

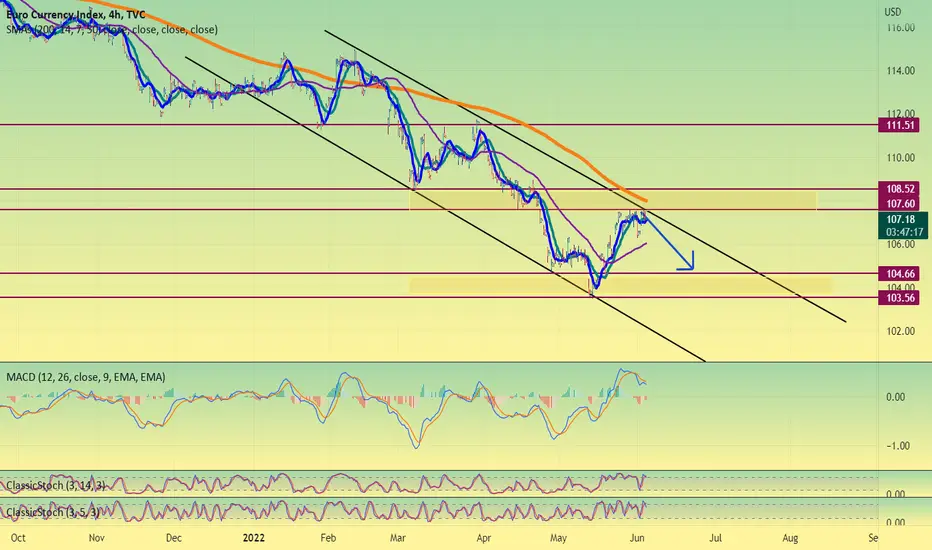
EXY shortexy has reached the resistance zone 107.60 and just little above it is 108.52. it seems there is alot of rejection happening from the resistance 107.6, it'll be quite hard for price to reach 108.5 resistance. looking at Macd if price reaches the bearish divergence the price can reach back to 104. This is possible since weekly price is still in bearish zone.
exyexy
important zone
can it tuch 1.03 ????
exy
important zone
exy
important zone
exy
important zone

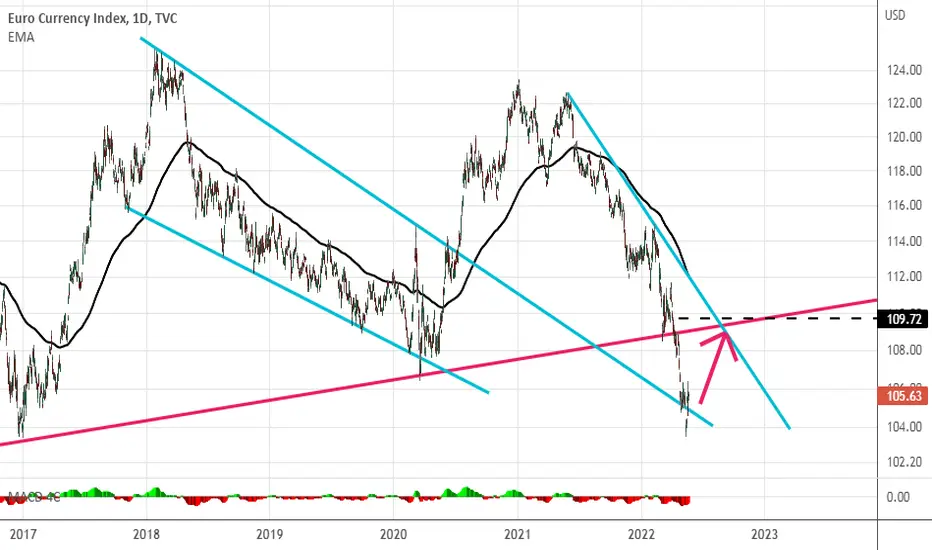
EXY is bullish toward 109.7Euro index is on a major trend line which acts as support for this index
we see a divergence on MACD which make us more determined for this bullish analysis
target of index is 109.7 for which index will touch another pink major trenline
as we analyzed previously, DXY is beaish for a while and EXY is bullish now according to this analysis ,so we will have better understanding of how EURUSD will move
any comments please share
tnx
EXY Too Many "Random" Things has Happened.The price action appears to contract on the macro level but if we take a look at each swing from a geometrical point of view we have so many textbooks events that lead me to the idea that we might have finished something here and we are going back into the contracting area which eventually we'll reach the apex when we decide which way we are going in terms of trend. (This can happen earlier, of course, we just use the apex as a reference.)
We might have a reaction from here or not but breaking the white trendline it's quite a significant event for me so I will keep a close look on that one. (Obviously, the next chance will be when we test it from below in the case that we break it.)

EXY signal to bullishEXY signal to bullish
after make a perfect bullish divergence, EXY will be go bullish!

smashing the tradeshello traders in today's video ill be showing you how to be a professional trader

EURJPY; RETEST AND DOWNWARD CONTINUATIONHELLO TRADERS
Recently we have seen euro index EXY becoming very weak and showed a retracement at the start of the week and yesterday a continuation to the downside
EURJPY has been on a downtrend for weeks and for the past few days moved up and now retesting a strong support
a continuation to the downside is expected
GOODLUCK TRADERS
PEACE OUT

Euro Currency Index (EXY) Analysis 10/03/2021there exist a very steep Bearish Divergence between the price and MACD and Its Histogram, which is the sign of trend reversal.
the price has already broken the low bond of the ascending parallels Channel where it was rallying earlier.
price has retested the Support line and it didn't stand after the second attempt and now turned to resistance, which is a very important sign of the trend change and index fall
we can target the golden zone of the Fibonacci retracement of the impulsive wave in order to find the depth of the price correction and retracement.

exy euras long as it remain in down trend channel it will go down i think after it complt down trend it will start to going up

EXY Short CallBearish trend for EXY, Two strategies Placed, Must trail profit rather than booking complete profit.


Potential Short The Euro has weakened and had an increased sell pressure, especially against the dollar. I expect the pressure to continue until it reaches the next major support level.

Bullish Idea on EURO INDEXmy humble Analysis on EURO Currency index , we can go higher than the targets mentioned in the chart

Euro currency index short viewStrong bearish momentum after declining from the upper trend line, we are now at 50.0% pullback, and we can expect a further decline in the euro index to a 61.8% level.

Short on EXYin Daily time-frame we see a clearly Head & Shoulder pattern.
Also breaks another trend line and retest it, ready to booom!
Target level is 113

EUR possible possibilitiesTake note of both Dollar and Euro charts and deduce something out of it. Leave your views too


EXY 1DThe Euro Currency Index (EUR_I) represents the arithmetic ratio of four major currencies against the Euro: US Dollar, British Pound, Japanese Yen and Swiss Franc. All ratios are expressed in units of currency per Euro. The index was launched in 2004 by the exchange portal Stooq.com. Underlying are 100 points on 4 January 1971. Before the introduction of the European single currency on 1 January 1999 an exchange rate of 1 Euro = 1.95583 Deutsche mark was calculated.
Based on the progression, Euro Currency Index can show the strength or weakness of the Euro. A rising index indicates an appreciation of the Euro against the currencies in the currency basket, a falling index in contrast, a devaluation. Relationships to commodity indices are recognizable. A rising Euro Currency Index means a tendency of falling commodity prices. This is especially true for agricultural commodities and the price of oil. Even the prices of precious metals (gold and silver) are correlated with the index.
Arithmetically weighted Euro Currency Index is comparable to the trade-weighted Euro Effective exchange rate index of the European Central Bank (ECB). The index of ECB measures much more accurately the value of the Euro, compared to the Euro Currency Index, since the competitiveness of European goods in comparison to other countries and trading partners is included in it.


EURO CURRENCY INDEX TVCProfitable Deals Not a Lot Of Indicators
Good Analyse = 85% Easy Money
You can text me for a business
