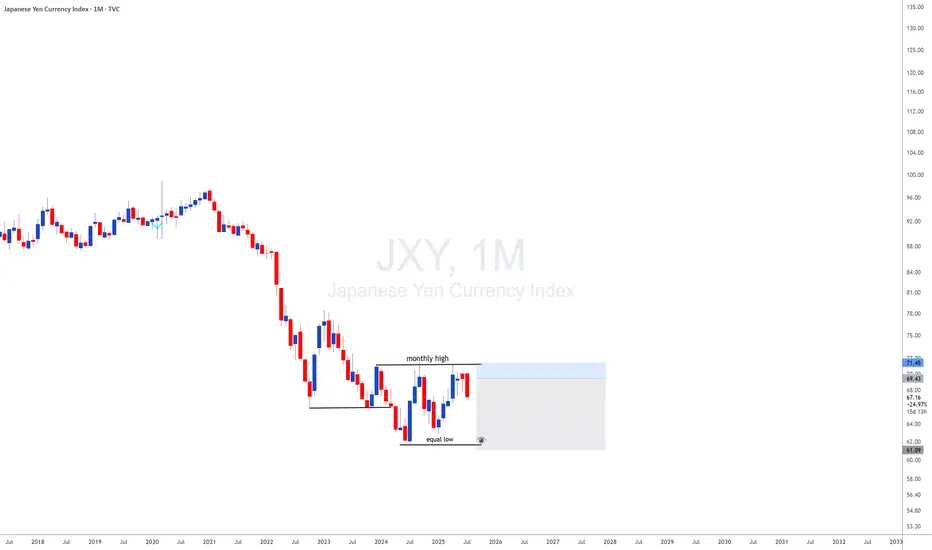
JXY with JXY looking monthly downside and DXY looing upside i will be looking for 35 years breakout of usdjpy meanning uj is a long therm upside
How to View the Assets in Japan
It should be noted that many of the assets the government owns are not marketable, or, if so, their
price can sharply drop in the case of fiscal crisis. Therefore, the financial situation should be assessed
first by gross debt.
In addition, the assets earmarked with the liabilities (such as pension reserves and FILP loans) are
not directly related to fiscal consolidation because they are not included in “Bonds outstanding of
central and local governments”, which is the benchmark of fiscal consolidation target
XDN trade ideas
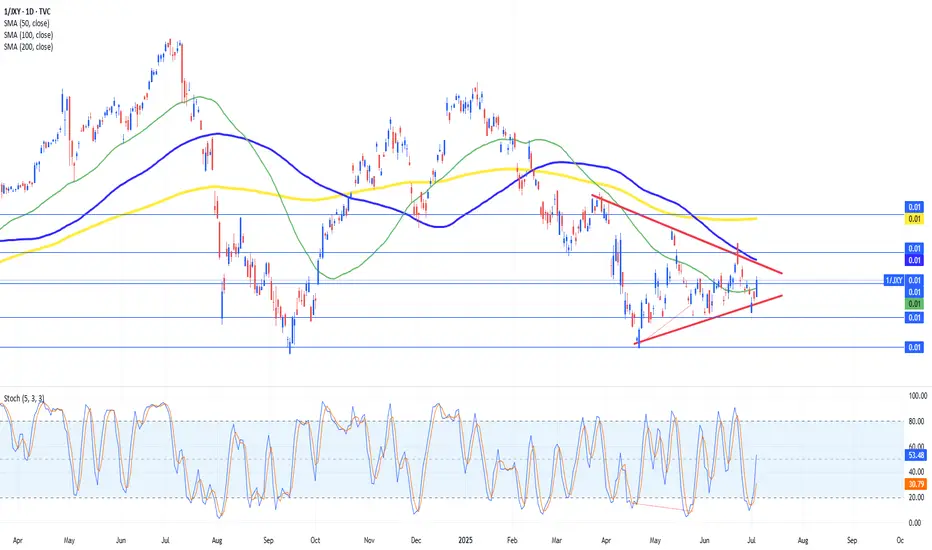
USDJPY Converges in Triangle Ahead of Potential BreakoutUSDJPY on the daily chart is coiling within a textbook contracting triangle, with support ascending near 143.00 and resistance compressing downward toward 147.00. This symmetrical structure suggests traders are awaiting a decisive catalyst, as volatility has steadily declined alongside rangebound price action.
Recent sessions show USDJPY respecting both its triangle boundaries and key moving averages. The 50- and 100-day SMAs near 145.00 have capped advances, while buyers have consistently defended dips toward 143.00. Price remains inside the triangle’s narrowing apex, hinting that a breakout could be imminent.
Technically, the pair has followed recent divergences between price action and the stochastic oscillator. RSI remains neutral near 49, offering little directional bias, while ATR confirms the tightening range with sharply falling volatility.
If bulls manage to push past 147.00 and the descending trendline, momentum could accelerate toward 149.00. Conversely, a daily close below 143.00 would invalidate triangle support and open the path toward 141.00. Until then, USDJPY may continue oscillating between these boundaries.
Fundamentals now favor the dollar, after stronger-than-expected U.S. jobs data showed 147,000 new positions added in June, beating forecasts. While private hiring slowed, the drop in unemployment to 4.1% supports a cautious Fed, likely delaying a rate cut until at least September. This labor resilience underpins near-term dollar strength.
With sentiment and structure aligning, USDJPY’s breakout from this triangle pattern may shape its next major move. Traders should watch for price and volatility confirmation above 147.00 or below 143.00.
JXY Stock Chart Fibonacci Analysis 061125Trading Idea
1) Find a FIBO slingshot
2) Check FIBO 61.80% level
3) Entry Point > 69.2/61.80%
Chart time frame:D
A) 15 min(1W-3M)
B) 1 hr(3M-6M)
C) 4 hr(6M-1year)
D) 1 day(1-3years)
Stock progress:A
A) Keep rising over 61.80% resistance
B) 61.80% resistance
C) 61.80% support
D) Hit the bottom
E) Hit the top
Stocks rise as they rise from support and fall from resistance. Our goal is to find a low support point and enter. It can be referred to as buying at the pullback point. The pullback point can be found with a Fibonacci extension of 61.80%. This is a step to find entry level. 1) Find a triangle (Fibonacci Speed Fan Line) that connects the high (resistance) and low (support) points of the stock in progress, where it is continuously expressed as a Slingshot, 2) and create a Fibonacci extension level for the first rising wave from the start point of slingshot pattern.
When the current price goes over 61.80% level , that can be a good entry point, especially if the SMA 100 and 200 curves are gathered together at 61.80%, it is a very good entry point.
As a great help, tradingview provides these Fibonacci speed fan lines and extension levels with ease. So if you use the Fibonacci fan line, the extension level, and the SMA 100/200 curve well, you can find an entry point for the stock market. At least you have to enter at this low point to avoid trading failure, and if you are skilled at entering this low point, with fibonacci6180 technique, your reading skill to chart will be greatly improved.
If you want to do day trading, please set the time frame to 5 minutes or 15 minutes, and you will see many of the low point of rising stocks.
If want to prefer long term range trading, you can set the time frame to 1 hr or 1 day.

Japanese Yen index Chart Fibonacci Analysis 052925Trading Idea
1) Find a FIBO slingshot
2) Check FIBO 61.80% level
3) Entry Point > 69/61.80%
Chart time frame:D
A) 15 min(1W-3M)
B) 1 hr(3M-6M)
C) 4 hr(6M-1year)
D) 1 day(1-3years)
Stock progress: A
A) Keep rising over 61.80% resistance
B) 61.80% resistance
C) 61.80% support
D) Hit the bottom
E) Hit the top
Stocks rise as they rise from support and fall from resistance. Our goal is to find a low support point and enter. It can be referred to as buying at the pullback point. The pullback point can be found with a Fibonacci extension of 61.80%. This is a step to find entry level. 1) Find a triangle (Fibonacci Speed Fan Line) that connects the high (resistance) and low (support) points of the stock in progress, where it is continuously expressed as a Slingshot, 2) and create a Fibonacci extension level for the first rising wave from the start point of slingshot pattern.
When the current price goes over 61.80% level , that can be a good entry point, especially if the SMA 100 and 200 curves are gathered together at 61.80%, it is a very good entry point.
As a great help, tradingview provides these Fibonacci speed fan lines and extension levels with ease. So if you use the Fibonacci fan line, the extension level, and the SMA 100/200 curve well, you can find an entry point for the stock market. At least you have to enter at this low point to avoid trading failure, and if you are skilled at entering this low point, with fibonacci6180 technique, your reading skill to chart will be greatly improved.
If you want to do day trading, please set the time frame to 5 minutes or 15 minutes, and you will see many of the low point of rising stocks.
If want to prefer long term range trading, you can set the time frame to 1 hr or 1 day.

Yen's Rate is Crawling Like a Speeding Crab.The rapid advancement of Japanese technology appears to be mirrored in the dynamic movement of the Yen index.
This index has swiftly reached the 1.276 Fibonacci level (71.3), and following a brief consolidation, it is now projected to advance towards the subsequent golden ratio at the 1.618 Fibonacci level (73.1).
This progression potentially allows other currencies the opportunity to converge and catch up with the Yen's performance.

I continue to sell JPY pairs (go long the yen)I've been long the JPY since the beginning of 2025. I recently closed an incredible OANDA:NZDJPY short position, which was very rewarding. Currently, I'm short CADJPY, CHFJPY, EURJPY, and GBPJPY.
My bullish bias for the yen continues. The yen index recently closed above a key horizontal level, signalling that there could be more upside.

Buy the Yen!If you've been following my content, you'll know I've been long the yen since the start of 2025. My short AUDJPY, CADJPY, EURJPY, NOKJPY, and NZDJPY positions are starting to pay off!
The yen index ( TVC:JXY ) recently closed above a key horizontal resistance at 66.00. This may signal the JPY may continue to strengthen and test the weekly range resistance at 71.00.
OANDA:AUDJPY
OANDA:CADJPY
OANDA:EURJPY
OANDA:GBPJPY
OANDA:NZDJPY
OANDA:USDJPY

Rci Signal
Description:
The RCI Signals indicator helps identify clear Buy and Sell signals by leveraging the RCI (Rank Correlation Index) technical analysis tool. By tracking the price ranking relationships across three different timeframes (short, mid, and long), this indicator supports traders in detecting potential trend reversals and confirming ongoing trends.
How It Works:
• Calculates the RCI Short (Short-Term), RCI Mid (Mid-Term), and RCI Long (Long-Term) values based on closing prices.
• Provides Buy signals when RCI indicates an upward reversal and Sell signals when a downward reversal is detected.
Trading Signals:
• Buy (Long): When RCI short < mid < long and RCI short begins rising along with price.
• Sell (Short): When RCI short > mid > long and RCI short begins falling along with price.
Features:
• Displays Buy/Sell signals directly on the price chart.
• Optional display of RCI Short, Mid, and Long values for detailed trend analysis.
• Easily customizable RCI periods (default 9, 26, 52 candles).
Benefits:
• Helps identify optimal entry and exit points.
• Reduces trading risks by clarifying market trends.
• Can be flexibly combined with other indicators for enhanced trading strategies.
Usage Instructions:
1. Add the indicator to your chart.
2. Customize the short, mid, and long RCI periods according to your trading strategy.
3. Observe the Buy (Green) and Sell (Red) signals directly on the price chart.
4. Enable the RCI value panel if you wish to monitor detailed RCI calculations.
Note:
• Best used in combination with other indicators for greater accuracy.
• Suitable for both short-term and medium-term trading.
Would you like any edits or additions before publishing this?

The Yen Crash Could be Finally Over.The Yen index trades at a really interesting level as we head into the BoJ rates decision.
We're trading at the 1.61 extension of the previous bull trap.
This is a big make or break level. A lot of consideration does have to be given towards the bear break. In a bear break the 1.61 hits. 1.27 often retests and then the 1.61 break.
If that happens, Yen can capitulate hard. Very important risk to be aware of.
However, if the 1.61 holds as support we might see a mean reversion move in this.
Mean reversion move in the Yen index after this prolonged downtrend would spell sensational crash moves in XXXJPY.
Very interesting decision to make in this zone. I think it sets the tone for the trend to either side.
Lot of epic trade setups in the XXXJPY pairs in the event it's a Yen reversal.

#JXY $JPY waiting a good days soon #Japan My expectations for the #JPY dollar in the next 2 months God wi
Maybe I'm wrong but I taking it


Yen Bullish Three Drives PatternHow to identify the Three Drives pattern?
The three drives harmonic pattern is identified by various three higher highs or lower lows. They gather in a reversal of the existing trend. Every move lower or higher is quantified by using the Fibonacci extension and retracement levels of 61.8 and 127.2 percent.
In some instances, the definition of the 3-drive pattern may be expanded to include various Fibonacci retracement or extension levels, like a 161.8 percent extension rather than a 127.2 percent extension. The pattern also works without Fibonacci levels, but it may be less accurate.
Bullish Three Drives pattern
The pattern begins with a bearish swing to give traders their first drive. Traders can then notice a retracement higher into the 61.8 percent level of the first drive to give traders the A point. From here, the price turns lower again to give the second drive which should complete into the 1.27 percent extension of the first drive.
From here, the price correct higher once more. It goes back up into the 61.8 percent retracement of the second drive to give us our B point. Then there will be one final push lower with price trading down to the 1.27 percent extension of the second drive to give a third drive that completes the pattern and offers a buying zone.

JXY (Long)
Price broke out of trend and came back to retest where it broke out.
Retest zone is within the 50-61.8 zone, which we are currently at so continue Yen strength.

JAPANESE YEN INDEXThe Japanese Yen index (JXY) has been on a long term bearish trend. Recent intervention by the BoJ has lifted the Yen. On the weekly charts, the Yen has broken a key level indicating a shift in order flow.
Price is expected to push higher to mitigate supply zones. In the short term, we expect the Yen to decline before resuming the bullish move. Consequently, majority of cross Yen pairs will push higher as the Yen index moves lower. Thereafter we expect the Yen to strengthen possibly towards the end of 2024.

WHAT'S FLOWING: AUDCNH / CADCHF / EURNOK / XR1. AUDCNH
Market Sentiment:
AUDCNH is showing some weakness, with analysis pointing towards potential declines towards key support levels near 4.500. The pair seems to be struggling amid mixed global sentiment towards Chinese economic growth and fluctuating Australian dollar strength.
Trade Idea:
Monitor the short setup if the pair continues downward pressure, especially with upcoming data releases from both economies likely to increase volatility.
(TradingView)
2. CADCHF
Market Context :
CADCHF has been steady as commodity-linked currencies remain sensitive to global oil prices and risk sentiment. Any further pressure on crude oil could create potential opportunities to short the CAD against the more stable Swiss franc.
Outlook:
Traders should keep an eye on oil developments and geopolitical news, which could influence CADCHF movements and create breakout opportunities.
3. EURNOK
Movement:
The euro remains sensitive against the Norwegian krone, with EURNOK reacting to oil price shifts. Norway’s economy, reliant on energy exports, continues to benefit from oil price surges. As energy markets evolve, the krone could further strengthen, putting downside pressure on EURNOK.
Strategy:
Consider potential downside plays, especially as oil markets remain volatile and in focus this week.
4. XRPUSD
Crypto Sentiment:
XRP has been fluctuating, with its market performance influenced by broader cryptocurrency volatility. Over the past few months, XRP has shown resilience, with increased trading activity recently supporting slight upward movements
(CoinMarketCap).
Trade Setup:
The token remains positioned for short-term speculative trades, with investors eyeing the 0.54-0.56 USD range as a key area to watch for potential breakouts or reversals.

JPY overview.The overall theme will revolve around JPY weakness, AUD strength and CAD weakness. there are a few assets on my watchlist that did not close last week with huge delta, but I have included them in here because I think they have pulled back / consolidated enough for them to resume their trend and so I might look to get involved in them if and when opportunity presents.
JPY in general - I see that it's weak and it should continue in that direction this week. I am going to post outlook on several key assets that I am looking to buy against JPY.
another interesting thing that I observed last week was low volume.
almost every asset had significantly low volume as compared to last week. especially JPY pairs as they sort of pulled back a bit and then buyers started to step in. JPY pairs had almost half volume last week as compared to the week before. this will give me a pause while looking for entries. not B or C grade setups for me this week. if I see normalcy coming in wrt volume this week, then I shall look to open up a bit in terms of taking B Grade entries.


JXY (LONG)
-JPY Bulls coming in
-morning star reversal pttern formed and we have bullish momentum
-All major resistance levels have been broken.

WILL YEN CROSS the RUBICON OR more BOJ "intervention"Spread btw spot and futs widened at breakout or reversal juncture


Waiting for a reversal signalFollowing the trend , price seems to at the lowest level where recent support was established , but waiting for a clear reversal signal with clear confluence , near 65.82 . Following wave theory price could over extend to that zone and clear price pattern structure could mean a clear reversal, with a flip in price near (@67.07, the recent lower high) in the lower time frames for a clear signal in a change in trend.

Rise of the YenJXY is almost completing 3 corrective wave and we can expect price to push up soon. Let me know in the comments if you have any questions

JPYAre you ready to embark on a profitable trading journey? Join us in seizing this golden opportunity by longing the yen. Here's your call-to-action:
1. Analyze the market: Conduct thorough research and analysis to understand the current market conditions and potential risks involved.
2. Develop a trading strategy: Create a well-defined plan that includes entry and exit points, risk management strategies, and profit targets.
3. Execute your trades: Open positions that reflect your trading strategy, longing the yen and going short on the US dollar/DXY.
4. Monitor and adjust: Keep a close eye on market movements and be prepared to adjust your trades if necessary. Stay informed and adapt your strategy accordingly.
5. Reap the rewards: As the yen strengthens and the US dollar/DXY might strengthen, watch your profits soar. Remember to stick to your plan and secure your gains when the time is right.
Conclusion:
Traders, the time to act is now! The potential for substantial profits awaits. Embrace this opportunity with enthusiasm and embark on a trading journey that could lead you to financial success. So, gear up, stay positive, and get ready to ride the waves of triumph!
