Bullish Velocity Divergence Signaling A ReversalNASDAQ:PBTS - Just recently made it’s 3rd bullish divergence with the daily velocity, signaling that it’s time for price to come back and retest the daily trigger. (Daily velo divergence, retest daily trigger) This is a simple system that is almost flawless. Given the circumstances and what this ti
Next report date
—
Report period
—
EPS estimate
—
Revenue estimate
—
−109.60 M USD
16.82 M USD
13.76 M
About X3 Holdings Co., Ltd.
Sector
Industry
CEO
Shiang Lor
Website
Headquarters
Singapore
Founded
1997
FIGI
BBG00N0D0PZ6
X3 Holdings Co., Ltd. engages in the provision of technology solutions and services spanning diverse industries. It operates through the following business segments: Digital Technologies, Crypto Mining, Renewable Energy, and Agriculture Technologies. The Digital Technologies segment facilitates digital transformation with solutions and services across the global trade supply chain. The Crypto Mining segment develops global and efficient crypto mining operations with sustainable energy sources. The Renewable Energy segment provides technology, and capital resources to help power a sustained future. The Agriculture Technologies segment provides smart solutions for enhanced farm efficiency. The company was founded by Shiang Lor in 1997 and is headquartered in Singapore.

PBTSThis is probably once in a lifetime high risk reward ration we can see on US STOCKS.
Bitcoin Mining Company, Power Bridge Technologies poised for massive upside.
Could go 28X or a higher 328X.
NFA

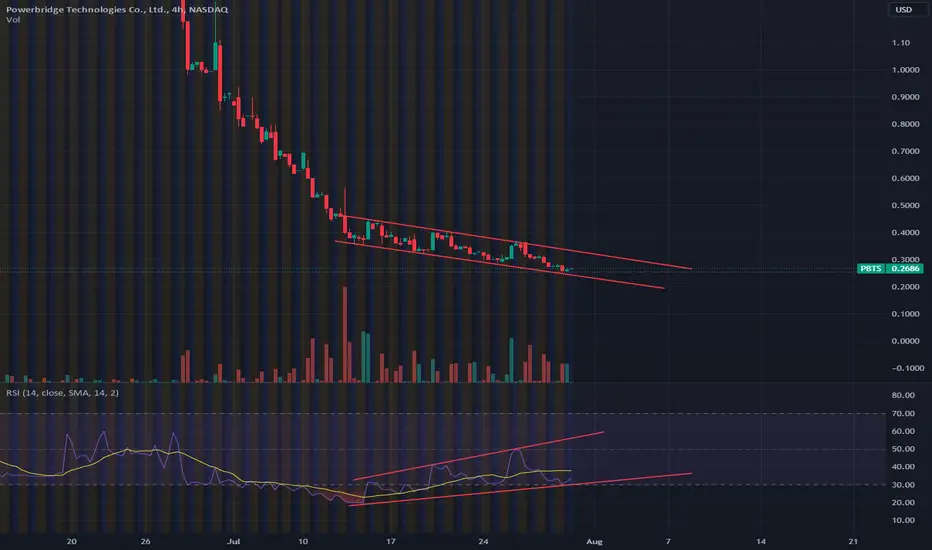
PBTS bullish divergence or hidden bearish divergencePBTS
I have trouble telling the difference, but to me this appears to be bullish divergence that could pop as soon as monday. i should also like to note that I know very little(nothing) about this chinese company. This trade is based entirely on my reading of the RSI.
PBTS to run up to 1.3Not sure when the bottom is, probably tomorrow.
I bought PBTS at .64 with a target sell front running 1.35.

$PBTS quadruple bottom chart?NASDAQ:PBTS looks like it's back at long term support. There is a history of spikes from this level, one to keep an eye on.

$PBTS bullish chartWedge forming on the chart, looks to be bottoming once again in the .09 range. Upside to .12+ in the short term and .25+ in the longer term IMO

PBTS BullishPBTS made a golden gross back in mid July and has rallied since. Price has been in the 1.20 to 1.40 range for about a month as it consolidated after a big rally.
I am intrigued by the OBV as it stayed somewhat steady since June, where even after the big spike and drop it barely moved down even tho

"PBTS" crypto power play opinionLooking for opinions on chart patterns,experienced more than myself,mining machines reported any day


$PBTS Reversal Inbound + Possible SqueezeVolume increase and reversal on charts + high shares shorted, last I check was around 6.5million shares borrowed

See all ideas
Summarizing what the indicators are suggesting.
Oscillators
Neutral
SellBuy
Strong sellStrong buy
Strong sellSellNeutralBuyStrong buy
Oscillators
Neutral
SellBuy
Strong sellStrong buy
Strong sellSellNeutralBuyStrong buy
Summary
Neutral
SellBuy
Strong sellStrong buy
Strong sellSellNeutralBuyStrong buy
Summary
Neutral
SellBuy
Strong sellStrong buy
Strong sellSellNeutralBuyStrong buy
Summary
Neutral
SellBuy
Strong sellStrong buy
Strong sellSellNeutralBuyStrong buy
Moving Averages
Neutral
SellBuy
Strong sellStrong buy
Strong sellSellNeutralBuyStrong buy
Moving Averages
Neutral
SellBuy
Strong sellStrong buy
Strong sellSellNeutralBuyStrong buy
Displays a symbol's price movements over previous years to identify recurring trends.
Related stocks
Frequently Asked Questions
The current price of XTKG is 1.0073 USD — it has increased by 5.03% in the past 24 hours. Watch X3 Holdings Co., Ltd. stock price performance more closely on the chart.
Depending on the exchange, the stock ticker may vary. For instance, on NASDAQ exchange X3 Holdings Co., Ltd. stocks are traded under the ticker XTKG.
XTKG stock has fallen by −18.11% compared to the previous week, the month change is a −10.06% fall, over the last year X3 Holdings Co., Ltd. has showed a −91.81% decrease.
XTKG reached its all-time high on Feb 17, 2021 with the price of 43,741.8003 USD, and its all-time low was 0.5300 USD and was reached on Mar 4, 2025. View more price dynamics on XTKG chart.
See other stocks reaching their highest and lowest prices.
See other stocks reaching their highest and lowest prices.
XTKG stock is 13.83% volatile and has beta coefficient of 1.42. Track X3 Holdings Co., Ltd. stock price on the chart and check out the list of the most volatile stocks — is X3 Holdings Co., Ltd. there?
Today X3 Holdings Co., Ltd. has the market capitalization of 13.19 M, it has increased by 5.66% over the last week.
Yes, you can track X3 Holdings Co., Ltd. financials in yearly and quarterly reports right on TradingView.
X3 Holdings Co., Ltd. is going to release the next earnings report on Sep 3, 2025. Keep track of upcoming events with our Earnings Calendar.
No, XTKG doesn't pay any dividends to its shareholders. But don't worry, we've prepared a list of high-dividend stocks for you.
As of Apr 23, 2025, the company has 178 employees. See our rating of the largest employees — is X3 Holdings Co., Ltd. on this list?
Like other stocks, XTKG shares are traded on stock exchanges, e.g. Nasdaq, Nyse, Euronext, and the easiest way to buy them is through an online stock broker. To do this, you need to open an account and follow a broker's procedures, then start trading. You can trade X3 Holdings Co., Ltd. stock right from TradingView charts — choose your broker and connect to your account.
Investing in stocks requires a comprehensive research: you should carefully study all the available data, e.g. company's financials, related news, and its technical analysis. So X3 Holdings Co., Ltd. technincal analysis shows the sell today, and its 1 week rating is sell. Since market conditions are prone to changes, it's worth looking a bit further into the future — according to the 1 month rating X3 Holdings Co., Ltd. stock shows the sell signal. See more of X3 Holdings Co., Ltd. technicals for a more comprehensive analysis.
If you're still not sure, try looking for inspiration in our curated watchlists.
If you're still not sure, try looking for inspiration in our curated watchlists.