ZM trade ideas
$ZM/Zoom Wedge brokenWe see a demand base at $345-$280 blocking the price to drop as a result of the falling wedge caused by the Q3-4 transition.
After the stock jumps above the wedge (breaking the trend, see red circle), we see it respecting & hovering around the 382 support established and respected at the following dates (10th December '20, 16th November '20, 10th November '20, 10th September '20, and the 11th September '20) - the price adjusts above and below the support, before starting to push upwards - showing that it *is* being used as a support and not a resistance level.
I can see the stock reaching (at least) the dotted blue line as it was used as a resistance in September and December '20 but was also used as a support back in late September and early October '20.

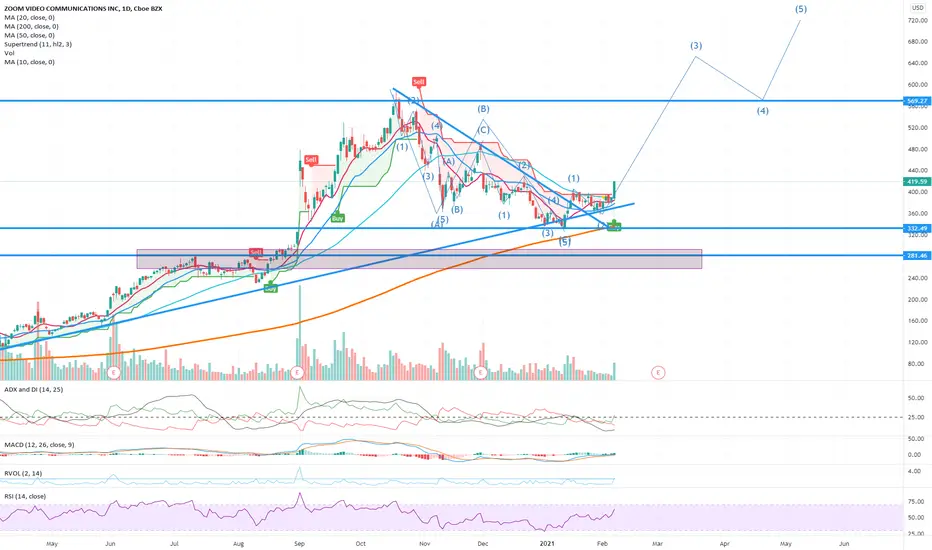
My take on ZM- On going wave 3
- Forming a inverse head and shoulders on correction waves ABC
- Price above MA50 and RSI 50

Zm LongZoom Just finished a 3 month correction .
A very nice falling wedge inside a Mega Phone, Bull market. Target is set at several levels.
very strong candle to break out of falling wedge. I only see blue skies here.
Happy Trading

ZM seems to be a buying opportunityThe ZM's long-term trend chart is presented. ___
Prompt: New traders should take some time and carefully read the post entitled 'You can't beat the market' that is located in my profile.
Disclaimer
The author of this text is not an investment advisor. The preceding content is intended to be used for informational and educational purposes only.
It is not an advice or inducement for the purchase or sale of the products mentioned. Before making any investment based on your own personal circumstances,
it is very important to do your own research and analysis and also take independent financial advice from a professional to verify any information provided here.

ZM Long IdeaDon't know exactly why, but COVID stocks are acting well. Look at FLGT, QDEL, PTON, NLS, ZM, TDOC, and the vaccine manufacturers. Meanwhile the market looks like it's breaking down. Maybe we'll get a nasty second wave. No idea. But ZM looks pretty solid here and I don't hate it as a long trade. It broke down from an obvious head and shoulders top, but bears couldn't take control. Now it's pushing against the downtrend line and the 20-day. I don't own it but will be watching.


Next boom for Zoom? ARK thinks so! Zoom Video Communications, Inc. is an American communications technology company that videotelephony and online chat services through a cloud-based peer-to-peer software platform and is used for teleconferencing, telecommuting, distance education, and social relations.
Evidence of the fact that $ZM is a Covid-19 play: Zoom’s share price has dropped in the wake of positive news about a coronavirus vaccine. On 9th November, $ZM stock dropped 15% in pre-market hours and is down 32% since the news.
Despite this, in quarterly results released Nov. 30, Zoom beat company and analyst estimates for its fiscal third quarter, with revenue up 367% year over year to $777.2 million, representing its third consecutive period with triple-digit percentage growth.
It is clear that investors are worried about $ZM being overvalued, hence its massive sell off form its $580 highs, likely set by fears about whether the company can maintain its success after people return to offices and schools.
The hybrid (some working form home and some working in the office), is likely to stay for some time. Zoom is great as it is cheaper than in-person meetings, especially for traveling, faster due to less travel time and more convenient.
Interestingly, Cathie Wood has been buying Zoom significantly in recent months. ARK invest has began buying $ZM for its ARKK ETF just 2 days before its ATH. Since then, ARK has been ‘buying the dips’ significantly with Zoom. For example, buying $13,500,000 worth of shares in for its ARKK fund in early November when the stock dropped 25% in two trading sessions and buying a further $32,000,000 shares in early December when the stock plunged 15% after earnings. As a result, the weighting of Zoom in the ARKK ETF has increased form 0.99% in mid-October to 1.53% now.
Let me explain the technicals. Firstly, ZM has been trading down and has been bouncing of a downward resistance line from its ATH. Secondly, the price has now retraced the 0.5 Fibonacci retracement zone, taking the $100 low and $588 highs, and is now sitting between the 0.5 and 0.618 level. This zone is often used by Fibonacci traders as a buy zone after a retracement. Thirdly, the price is currently approaching $325, which is significant as a large gap was created here on big earnings. Highlighted on the chart by the red rectangle. Gaps are often filled, but this is by no means universally true. Thirdly, there is some support to be found in an upward trend line formed from price action between April and May. Fourthly, the 200 period MA is aligning with this trendline which could act as further support. Finally, the RSI is approaching overbought levels.
Taken together, what does this mean? This could signify a reversal somewhere in the green circle – this is an area of bullish confluence given the gap fill, fib retracement level, support of the upward trendline, support of the 200 MA and the oversold RSI

ZM_Bearish ZM looks bearish and will need momentum after the large gap down in Nov that caused the LR to be bearish on ZM maybe a good time to get in right before earnings and see if it meets more headwinds...it may not find itself over 500$ in the next month...depending on market conditions ...tje earnings last quarter dampened the stock which technically the day before was very bullish...


A good discount price for Zoom Video Communications, Inc ZM!Zoom Video Communications INC with stock symbol ZM is at a major price level of $375.17 as of market close on December 24, 2020. Some thoughts on portfolio management and risk management for new traders and new buyers looking into trading this stock or hold the stock as a long-term investment. This is a good discount price for this stock; however, new buyers should be very careful because this correction may continue further. Buyers should watch for a true bottom before entering this stock. If the price enters the price level from $324.65 to $350.46, the stock may bottom in that price range or the stock may drop quicker and harder to a price level around $275. Remember the old saying, "Don't put all your eggs in one basket."
Thank you for reading! Remember to click "Like" and "Follow!"
Greenfield
Disclosure: Chart interpreted by Greenfield. Just a market opinion by Greenfield Analysis LLC for educational purposes. This is not a recommendation. Greenfield Analysis LLC has no investment in any of the securities mentioned in the article, and no plan to initiate a trade in any of the securities mentioned. Greenfield does not receive any compensation for this writing. Investment involves substantial risk. You should consider carefully before making an investment. Investment at your own risk.

$ZM Mini Head & Shoulders (Inside the Right Shoulder)The 2 months head and shoulders bottom I pointed out few days ago is now building another mini head and shoulders pattern that makes up the right shoulder in the bigger pattern. She is really trying to go. Expecting something to give here :)


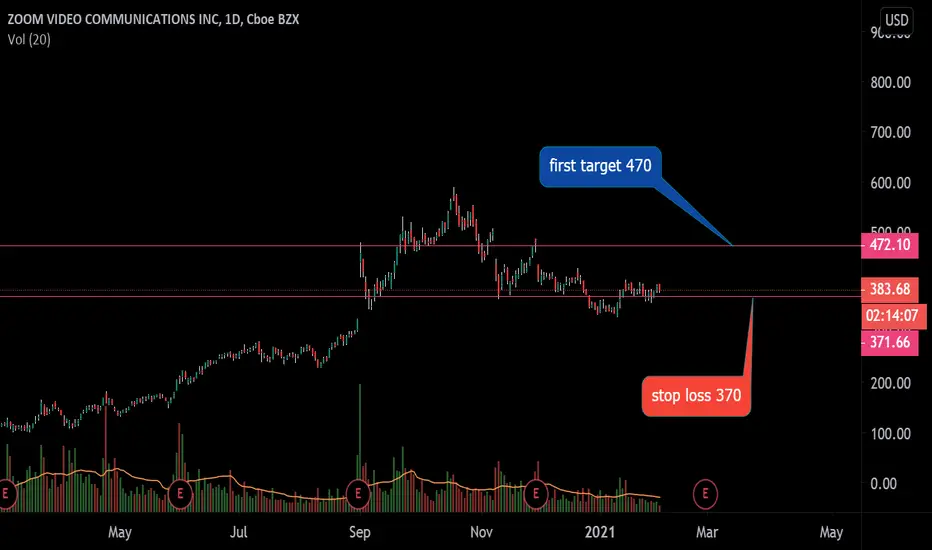
ZM LongUptrend, EMA55/144 as support Zone
Wedge Breakout + revisit trend line
Entry 385
Stop 350
Target 500
I am not a PRO trader. I trade option to test my trading plan with small cost.
The max Risk of each plan is less than 1% of my account.
If you like this idea, please use SIM/Demo account to try it.

head and shoulders chart patternWith this formation, we would place a long entry order above the neckline.
Our target is calculated just like the head and shoulders pattern.
Measure the distance between the head and the neckline, and that is approximately the distance that the price will move after it breaks the neckline.


ZMZm brokw out of a decending wedge and was accumilationg again, It formed a inverse head and shoulder’s and also a cup breakout
