NATURAL GAS (NATGASUSD): Bullish Outlook Explained
Natural Gas is trading in a mid-term bullish trend on a daily.
The price updates higher highs and higher lows after each
test of a rising support line.
Its last test made the market form a strong rejection first
and a bullish engulfing candle then.
The market may continue growing and reach at least 3.7 resistance soon.
❤️Please, support my work with like, thank you!❤️
NATGAS trade ideas

Natural Gas is in the Buying DirectionHello Traders
In This Chart NATGAS HOURLY Forex Forecast By FOREX PLANET
today NATGAS analysis 👆
🟢This Chart includes_ (NATGAS market update)
🟢What is The Next Opportunity on NATGAS Market
🟢how to Enter to the Valid Entry With Assurance Profit
This CHART is For Trader's that Want to Improve Their Technical Analysis Skills and Their Trading By Understanding How To Analyze The Market Using Multiple Timeframes and Understanding The Bigger Picture on the Charts

XNG/USD Market Swipe: Bullish Breakout Blueprint!🌟 Natural Gas Heist: XNG/USD Bullish Breakout Plan 🌟
Hey Money Snatchers & Market Raiders! 🤑💸
Ready to pull off a slick heist on the XNG/USD "Natural Gas" Energy Market? 🔥 Using our slick Thief Trading Style (technical + fundamental analysis), here’s the plan to grab the bullish loot and dodge the bearish traps! 🏴☠️💰
Entry 📈:
The vault’s cracked open! 🕳️ Snag the bullish loot at any price—swing low/high pullbacks are prime. Set buy limit orders in 15/30-min timeframes near swing levels for clean entries. 🕵️♂️
Stop Loss 🛑:
📍 Place your Thief SL below the moving average swing low candles on the 3H timeframe for swing/scalp trades.
📍 Adjust SL based on your risk, lot size, and multi-order setups. Stay sharp! ⚡
Target 🎯:
Aim for 3.900 or bail before the high-risk RED Zone (overbought, consolidation, or trend reversal). Bears lurk there—don’t get caught! 🐻🚨
Scalpers 👀:
Stick to long-side scalps. Got big cash? Jump in! Smaller stack? Join swing traders with a trailing SL to lock in profits. 💰🛡️
Market Vibes ⛽:
XNG/USD is shaking off bearish vibes, fueled by fundamentals, COT reports, inventory, seasonal trends, and sentiment. Check our bio0 for links to dive deeper! 🔗🌎
⚠️ News Alert 📰:
News drops can spike volatility. Play it safe:
Skip new trades during news releases. 🚫
Use trailing stop-loss to guard profits. 🔒
💥 Boost the Heist! 💥
Hit that Boost Button to power up our robbery squad! 💪 With Thief Trading Style, we’re stealing profits daily. Stay tuned for the next heist plan! 🐱👤🚀
Let’s swipe the cash and celebrate! 🎉💸

Natural Gas Long baby!Price showed rejection with reversal signal on lower channel. I am gonna buy this and project this to higher high formation. Cheers

Natural Gas plummets - Israel and Iran PeaceIran and Israel de escalation is causing nat gas to plummet.
Fear of the "Hormuz Strait" closing have slipped away!
Roughly 20% of global liquefied natural gas (LNG) trade flows through the Strait of Hormuz, primarily from Qatar (~9.3 Bcf/d) with smaller volumes from the UAE (~0.7 Bcf/d)
In 2024, approximately 83–84% of those LNG volumes were destined for Asian markets—China, India, South Korea

Natural Gas Buy Setup – Multi-Timeframe Bullish Confluence🔥 Weekly Overview:
Price has just rejected the weekly EMA after forming a strong rejection candle. This signals potential support at the dynamic level and hints at a bullish shift. Buyers are likely stepping in from this zone.
📅 Daily Chart Explanation:
On the daily timeframe, price has broken its internal bearish structure and flipped to the buy side. It is now trading above both the 14EMA and 50EMA, using them as dynamic support. This shift confirms the transition from a downtrend into a new bullish leg.
⏱ 4H Chart Explanation:
The 4H chart shows a clean structure break to the upside, with price now making Higher Highs and Higher Lows. The 4H 50EMA is now acting as support. A strong bullish move has confirmed the presence of buyers, and the market is favoring long positions.
📌 Plan
Bias: Bullish
Entry: Wait for a pullback to the 4H discounted zone (around 50EMA or structure support) and look for confirmation (bullish engulfing, pin bar, or trendline bounce) on the 1H or 15M chart.
Targets:
🎯 TP1: Previous daily high
🎯 TP2: Weekly resistance zone or supply area
Invalidation: If price breaks and closes below the recent 4H Higher Low and the 50EMA with bearish momentum.

NATURAL GAS XNGUSDCorrelations: Natural Gas, Bond Yields (US10Y), DXY, and Seasonal Patterns
1. Natural Gas and 10-Year Treasury Yield (US10Y)
Positive Correlation: Natural gas prices and the 10-year Treasury yield tend to move in tandem, driven by shared macroeconomic forces like inflation expectations and growth outlooks.
Mechanism: Rising yields signal economic strength or inflation, boosting industrial/energy demand and gas prices. Conversely, falling yields often align with gas price declines during economic softening.
2. Natural Gas and US Dollar Index (DXY)
Inverse Relationship (Historically): A stronger dollar (DXY↑) typically pressures natural gas prices, as dollar-denominated commodities become costlier for global buyers, reducing demand.
Exception: During extreme supply disruptions (e.g., geopolitical crises), a strong dollar and gas prices can rise together if global energy shortages override currency effects.
Recent Weakness: This correlation has diminished in 2024–2025, with DXY and gas prices occasionally moving independently amid supply shocks (e.g., LNG export surges).
3. Seasonal Impact on Natural Gas (Winter vs. Summer)
Winter (Peak Demand):
Demand: Heating needs (residential/commercial) drive consumption to yearly highs (e.g., 30+ Bcf/d in U.S. residential use).
Price Impact: Colder winters amplify price spikes, especially if storage inventories are low or supply chain disruptions occur.
Summer (Secondary Peak):
Demand: Electricity generation for cooling sustains demand, though typically below winter peaks.
Price Impact: Heatwaves can cause short-term surges, but prices generally remain lower than in winter.
4. Seasonal Influence on Correlations
Winter:
US10Y Correlation Strengthens: Inflation fears from heating demand can push yields and gas prices higher together.
DXY Correlation Weakens: Geopolitical supply risks (e.g., Russia-Ukraine tensions) may decouple gas from dollar strength.
Summer:
US10Y Correlation Muted: Cooling demand is less inflation-sensitive, weakening the gas-yield link.
DXY Correlation Resumes: Stronger dollar more consistently pressures gas prices absent winter-like crises.
Key Drivers Macro growth/inflation expectations Global trade costs, currency flows Weather, storage levels
Conclusion
Natural gas exhibits a strong positive correlation with 10-year yields (driven by shared macro sensitivity) and a historically inverse link to the dollar (though recently unstable). Seasonal peaks in winter amplify gas-yield ties due to inflation risks, while summer realigns gas with dollar dynamics. Geopolitical or supply shocks can override these patterns, particularly in winter.
#DOLLAR #GAS

NATURAL GASNatural gas prices have pulled back from a 2½-month high due to forecasts of normalizing summer temperatures in the U.S., which could reduce cooling demand and electricity generation needs.
Demand Drivers:
U.S. LNG exports are ramping up, supporting demand and prices. LNG export facilities like Plaquemines LNG and Corpus Christi Stage 3 began production in late 2024, with more capacity expected in the next two years.
Domestic demand for natural gas in power generation is expected to rise seasonally in summer, with June electric power consumption projected to be about 25.7% higher than May.
Supply Factors:
U.S. dry gas production remains robust, currently around 106.7 billion cubic feet per day (Bcf/d), up 3.3% year-over-year.
Natural gas inventories are near five-year averages but expected to end the injection season (October 31) about 3% below average due to strong demand and exports.
Price Forecast:
The U.S. Energy Information Administration (EIA) projects Henry Hub spot prices to average around $4.00/MMBtu in 2025 and rise further to about $4.90/MMBtu in 2026, driven by increased LNG exports and domestic consumption growth.
Conclusion
Natural gas prices are currently moderating after recent gains but remain supported by strong export demand and seasonal power consumption increases. The market outlook is for prices to rise through 2025 and 2026 as LNG exports expand and domestic demand grows, despite some short-term weather-driven fluctuations.
#LNG #USOIL #DOLLAR

NATGAS - New Potential Moves🔥 NATGAS – Major Move Loading 🔥
We’re sitting at a critical 4D Supply zone right now.
📌 If this level holds — expect rejection and a move back into lower liquidity zones.
📌 But if price breaks through this 4D supply, it opens the door to massive upside potential.
Either way, this is a high-impact level. Big moves are coming. Eyes locked. 👀
#NatGas #CommoditiesTrading #SmartMoney #SupplyDemand #PriceAction #TradingSetup #SwingTrade #ForexAnalysis #MarketStructure #LiquiditySweep

NATURAL GAS Natural gas prices have pulled back from a 2½-month high due to forecasts of normalizing summer temperatures in the U.S., which could reduce cooling demand and electricity generation needs.
Demand Drivers:
U.S. LNG exports are ramping up, supporting demand and prices. LNG export facilities like Plaquemines LNG and Corpus Christi Stage 3 began production in late 2024, with more capacity expected in the next two years.
Domestic demand for natural gas in power generation is expected to rise seasonally in summer, with June electric power consumption projected to be about 25.7% higher than May.
Supply Factors:
U.S. dry gas production remains robust, currently around 106.7 billion cubic feet per day (Bcf/d), up 3.3% year-over-year.
Natural gas inventories are near five-year averages but expected to end the injection season (October 31) about 3% below average due to strong demand and exports.
Price Forecast:
The U.S. Energy Information Administration (EIA) projects Henry Hub spot prices to average around $4.00/MMBtu in 2025 and rise further to about $4.90/MMBtu in 2026, driven by increased LNG exports and domestic consumption growth.
Conclusion
Natural gas prices are currently moderating after recent gains but remain supported by strong export demand and seasonal power consumption increases. The market outlook is for prices to rise through 2025 and 2026 as LNG exports expand and domestic demand grows, despite some short-term weather-driven fluctuations.
#LNG #USOIL #DOLLAR

Navigating a Pullback in Natural GasNatural gas prices have been on a wild ride lately, with a recent pullback raising questions about the future of this energy source. This video provides insights into navigating this market volatility, offering actionable strategies for live trading in the midst of uncertainty.
Current weather forecasts for the U.S. show neither extreme heat nor cold—limiting heating or cooling demand. This typical spring-to-summer lull supports low prices .
Although rig counts in the U.S. are falling—the latest count shows an 8‑week decline—production remains ample. Storage levels remain healthy, and oversupply worries persist .
Natural gas rallied earlier today but faced resistance at the $4/mmBtu mark—a major psychological barrier. After hitting that ceiling, prices gave back gains, a typical sign of "rally exhaustion"

Shift in the down trend and a new wave is coming Hello Traders,
i would like to thank every one who support the prev idea when it was head and shoulders and early notifiess to go down, and now i have seen another pattern its the Diamond for those who doesnt know it signals a potential trend reversal, similar to a diamond-shaped formation. It typically occurs after an extended trend and indicates a period of consolidation before a potential breakout in the opposite direction. The pattern can be bearish (Diamond Top) or bullish (Diamond Bottom), forming at or near market tops and bottoms, respectively,
so it was formed on the 1hr frame my target will be prev hight at 3.8
good luck stop loss is under the prev low 3.58
kindly show the support for me so i can continue posting my ideas thats help me alot that i have a view and it could be right thanks again.

Natural Gas Explodes - Bullish Option ContractsTechnical Breakout Observed! Huge upside potential!
Inverse Head & Shoulders breakout on daily chart.
Weekly Bullish Cross 7/20 MA.
- Increased Demand: After a sluggish 2024, demand for natural gas is rebounding—especially for electricity generation in North America and Asia. This is tightening the market and pushing prices up.
- LNG Export Boom: New liquefied natural gas (LNG) export terminals, like the one coming online in British Columbia, are expanding shipping capacity. That’s opening up more international markets and driving up prices domestically.
- Geopolitical Tensions: Broader energy markets are reacting to instability in the Middle East, particularly between Iran and Israel. While this directly impacts oil, it also creates uncertainty across all energy commodities, including natural gas.
- Inventory and Supply Adjustments: After oversupply in 2024, producers are now recalibrating. But with inventories still low in some regions, prices are sensitive to even small disruptions

Natural Gas - Soaring Upside - Option Plays!Technical Breakout Observed! Huge upside potential
- Increased Demand: After a sluggish 2024, demand for natural gas is rebounding—especially for electricity generation in North America and Asia. This is tightening the market and pushing prices up.
- LNG Export Boom: New liquefied natural gas (LNG) export terminals, like the one coming online in British Columbia, are expanding shipping capacity. That’s opening up more international markets and driving up prices domestically.
- Geopolitical Tensions: Broader energy markets are reacting to instability in the Middle East, particularly between Iran and Israel. While this directly impacts oil, it also creates uncertainty across all energy commodities, including natural gas.
- Inventory and Supply Adjustments: After oversupply in 2024, producers are now recalibrating. But with inventories still low in some regions, prices are sensitive to even small disruptions

Natural Gas Prices on the RiseNatural Gas Prices on the Rise
As shown on the XNG/USD chart today, natural gas prices are trading around $3.960 per MMBtu — the highest level in over a month. This week’s series of bullish candles confirms strong demand.
Natural gas is becoming more expensive due to concerns over the military conflict between Iran and Israel. According to media reports:
→ Israel has attacked Iran’s South Pars gas field, and Donald Trump has called for the evacuation of Tehran.
→ Market participants fear that a blockade of the Strait of Hormuz could disrupt oil and natural gas supply chains.
In addition, forecasts of extreme heat in the US and increased demand for gas-powered air conditioning are also pushing prices higher.
Technical Analysis of the XNG/USD Chart
The chart shows that since mid-May, natural gas price movements have formed a narrowing triangle, suggesting a temporary balance between supply and demand.
However, the triangle has been broken to the upside — a sign of demand strength — with the price:
→ breaking through resistance at $3.800 per MMBtu;
→ forming the outlines of an ascending channel (shown in blue).
The following factors could act as resistance to the current upward move in natural gas prices:
→ the upper boundary of the channel;
→ the psychological level of $4.000 per MMBtu, near the May peak.
However, given that the hottest months of summer lie ahead and the situation in the Middle East remains highly volatile, it is reasonable to assume that the upward trend may continue.
This article represents the opinion of the Companies operating under the FXOpen brand only. It is not to be construed as an offer, solicitation, or recommendation with respect to products and services provided by the Companies operating under the FXOpen brand, nor is it to be considered financial advice.

NGAS - UniverseMetta - Signal#NGAS - UniverseMetta - Signal
D1 - Formation of the 3rd wave in continuation of the uptrend + price upper border of the triangle. It is better not to increase risks. Stop behind the minimum of wave D.
Entry: 3.8428
TP: 4.0289 - 4.4307 - 4.7987 - 5.4246
Stop: 3.4453

Natural Gas: Bullish Setup Within a Triangle, Targeting $4.90A promising situation is forming in natural gas. I believe we can expect further growth in the asset. The trend is bullish, volatility has decreased, and the price has consolidated into what looks like a triangle — from which I expect an upward breakout.
What concerns me slightly is today's gap up at the open.
I'm not rushing into a position just yet. I'm planning to enter around the 3.671 level. Ideally, the gap would get filled — likely closer to the opening of the U.S. session or during it. For now, I'm observing and looking for a proper entry point.
Medium-term target: $4.90
And most importantly:
Always place stop-losses right away. Risk management is key: choose your position size carefully — this is a volatile asset. Don’t forget that!

Technical Analysis Summary - NG🔍 Technical Analysis Summary – Natural Gas (NG1!)
📉 Left Chart (Daily Timeframe – ABC Correction):
Market structure shows a clear ABC corrective pattern forming.
Wave A completed with a sharp down move.
Wave B retracement is also complete.
Now initiating Wave C, projecting a downside target near $2.90–$3.00.
The structure indicates a correction within a larger downtrend continuation.
📊 Right Chart (90-Minute Timeframe – Elliott Impulse):
The chart breaks down Wave C into an impulsive 5-wave structure:
Wave I: Down move from ~$3.90 to ~$3.45.
Wave II: Pullback (currently ending).
Wave III, IV, V: Projected further downside.
Final target: $2.85–$2.90 region.
Multiple EMAs (34, 62, 89, 144) show bearish alignment — resistance in recent pullback.
Price action is below all EMAs, confirming bearish trend continuation.
📌 Conclusion:
Natural Gas is likely entering Wave C of a larger ABC correction.
Expect further downside with potential targets:
Short-term: $3.10
Mid-term: $2.85–$2.90
Trend remains bearish unless price reclaims above the EMA cluster (~$3.65–$3.80).
⚠️ Disclaimer:
This analysis is for educational purposes only. It is not financial advice. Please consult your financial advisor before making any trading decisions.

Natural Gas (NG1!) Analysis 📈 Natural Gas (NG1!) Analysis – Triangle Breakout Imminent
The Natural Gas 30-minute chart has formed a contracting triangle over the past several sessions, with volatility compressing into a tighter range. This pattern typically signals an impulsive move once the breakout occurs.
We now see the triangle structure complete, and the market is poised for a decisive breakout in one direction.
🔍 Technical Breakdown:
🟦 Pattern: Contracting Triangle
⏳ Structure: 5-leg consolidation appears complete
📌 Current Price: ~3.68 USD
📈 Bullish Breakout Target: 3.84
A breakout above the upper triangle trendline confirms the bullish momentum.
📉 Bearish Breakdown Target: 3.37
A breakdown below the lower support line will invalidate the bullish structure and may lead to a swift decline.
🧭 Trading Plan:
Watch for a breakout with confirmation volume
Ideal to enter after a breakout retest, especially on the 15m or 1h chart
Set stop-loss just inside the triangle opposite your trade direction
⚠️ Disclaimer:
This analysis is for educational and informational purposes only. It is not financial advice or a recommendation to buy or sell any asset. Always do your own research and consult your financial advisor before making trading decisions.

Natural Gas Flag PatternPurely based on flag pattern. According to flag pattern outbreak somewhere end of June. Just an opinion, NG always does his own thing.
TP1: 4.00
TP2: 4.40
TP3: 4.80
SL: 3.35

Natural gas poised for breakoutNatural gas prices are compressing inside a small ascending triangle, but this is only part of a larger pattern pointing to even greater upside. This video explains why natural gas could be the market to watch in the coming weeks.
This content is not directed to residents of the EU or UK. Any opinions, news, research, analyses, prices or other information contained on this website is provided as general market commentary and does not constitute investment advice. ThinkMarkets will not accept liability for any loss or damage including, without limitation, to any loss of profit which may arise directly or indirectly from use of or reliance on such information.

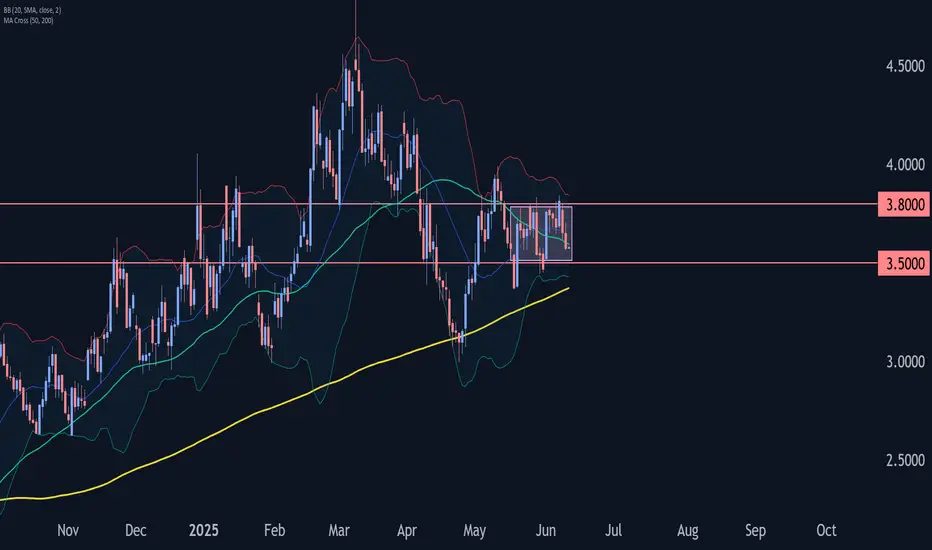
Natural Gas Wave Analysis – 10 June 2025
- Natural Gas reversed from key resistance level 3.80
- Likely to fall to support level 3.50
Natural Gas recently reversed down from the pivotal resistance level 3.80 (which is the upper border of the narrow sideways price range inside which the price has been trading from May).
The downward reversal from the resistance level 3.80 created the daily Japanese candlesticks reversal pattern Bearish Engulfing.
Given the strong daily downtrend, Natural Gas can be expected to fall to the next support level 3.50 (lower border of the active price range, low of waves (2) and 2).
NATGAS 8H - Time frame Analysis📈 Natural Gas 8H – Bullish Setup Breakdown 🔥
Price is showing strong bullish intent after reclaiming a key demand zone and respecting the ascending trendline. We’ve got multiple confirmations stacking up:
✅ Trendline support holding perfectly — showing consistent higher lows
✅ Demand zone reclaimed — price now basing above previous resistance
✅ 200 EMA flip — acting as dynamic support
✅ Rising volume on bullish candles = buyers stepping in
✅ Breakout from mini swing range underway
🎯 Trade Plan:
🔹 Entry: 3.42 – 3.48
🔹 Stop Loss: Below 3.28
🔹 Target 1: 3.80 (local highs)
🔹 Target 2: 4.30 (buy-side liquidity grab)
